Customer Base Analysis: RFM and ABC Methods with Examples


TL;DR
Customer base analysis groups customers by value, stability, and behavior to manage sales and churn more precisely. This article covers three practical methods — ABC analysis (Pareto principle), XYZ analysis (demand stability), and RFM analysis (recency, frequency, monetary) — with formulas, a worked example using the same customers throughout, a table template, and an action checklist for each segment.
Customer base analysis is ongoing work to split customers into groups so you understand who brings in money, who is leaving, and who should be offered what. Without it, budget gets spread evenly across the board: a customer with a million-ruble ticket gets the same attention as a one-time buyer spending a thousand rubles. Below are three proven customer base analysis methods (ABC, XYZ, and RFM) with formulas, a table template, and a worked numerical example using the same set of customers throughout.
What a customer base is and why you should analyze it
A customer base is a structured set of data about your buyers: contacts, transaction history, amounts, dates, and contact channels. Customer analysis turns this raw data into decisions: where to focus your sales team’s effort, whom to retain, and whom you shouldn’t be subsidizing with discounts.
Why analyzing your customer base matters in practice:
- Prioritization. Understand which customers generate the bulk of revenue and profit.
- Retention. Spot customer churn early — those who have stopped buying.
- Growing average order value and purchase frequency through targeted offers.
- Planning. Assess demand stability and reduce cash flow gaps.
- Budget efficiency. Avoid spending expensive touchpoints on low-potential segments.
Customer analytics can be descriptive (what already happened) or predictive (what’s likely to happen). ABC, XYZ, and RFM are descriptive methods, but they lay the groundwork for forecasts and for calculating customer CLV.
What data you need to collect for analysis
Here’s the minimum set of fields without which customer base analysis methods won’t work:
| Field | Why it’s needed | Which method uses it |
|---|---|---|
| Customer ID / name | Identification | All |
| Date of each transaction | Recency and stability | RFM, XYZ |
| Transaction amount | Revenue, average order value | ABC, RFM |
| Profit / margin | True value | ABC (more accurate than revenue) |
| Number of purchases | Purchase frequency | RFM, XYZ |
| Channel / segment | Analytical breakdowns | All |
Separately, keep personal data requirements in mind: collecting and storing contacts requires customer consent and compliance with applicable law. For ABC/XYZ/RFM calculations, anonymized transaction data is enough — you don’t need names or phone numbers for the math.
Ways to grow your customer base
Before you can analyze a base, you need to build one. Briefly, here’s how to grow your customer base legally and without junk contacts:
- Lead magnets — a useful resource (checklist, calculator, guide) in exchange for a contact. Works in both B2B and services.
- CRM logging of every inquiry — every incoming call, request, or chat gets recorded in the system.
- Loyalty programs — a card or personal account with purchase history.
- Offline touchpoints — contracts, warranty cards, invoices.
- Partner and referral channels — contacts gained through recommendations.
What matters more than volume is the contact-to-deal conversion rate and data completeness. An empty base of 50,000 rows with no purchase history is useless for analytics.
ABC customer analysis: the concept, the Pareto principle, and when to use it
ABC customer analysis ranks customers by contribution to revenue (or profit) and splits them into three groups: A — the most valuable, B — mid-tier, C — secondary. It’s built on the Pareto principle in sales: roughly 20% of customers generate about 80% of results.
- Group A — ~20% of customers, ~80% of revenue. Key accounts requiring personal attention.
- Group B — ~30% of customers, ~15% of revenue. Potential candidates to move up to A.
- Group C — ~50% of customers, ~5% of revenue. The mass segment — automate the work here.
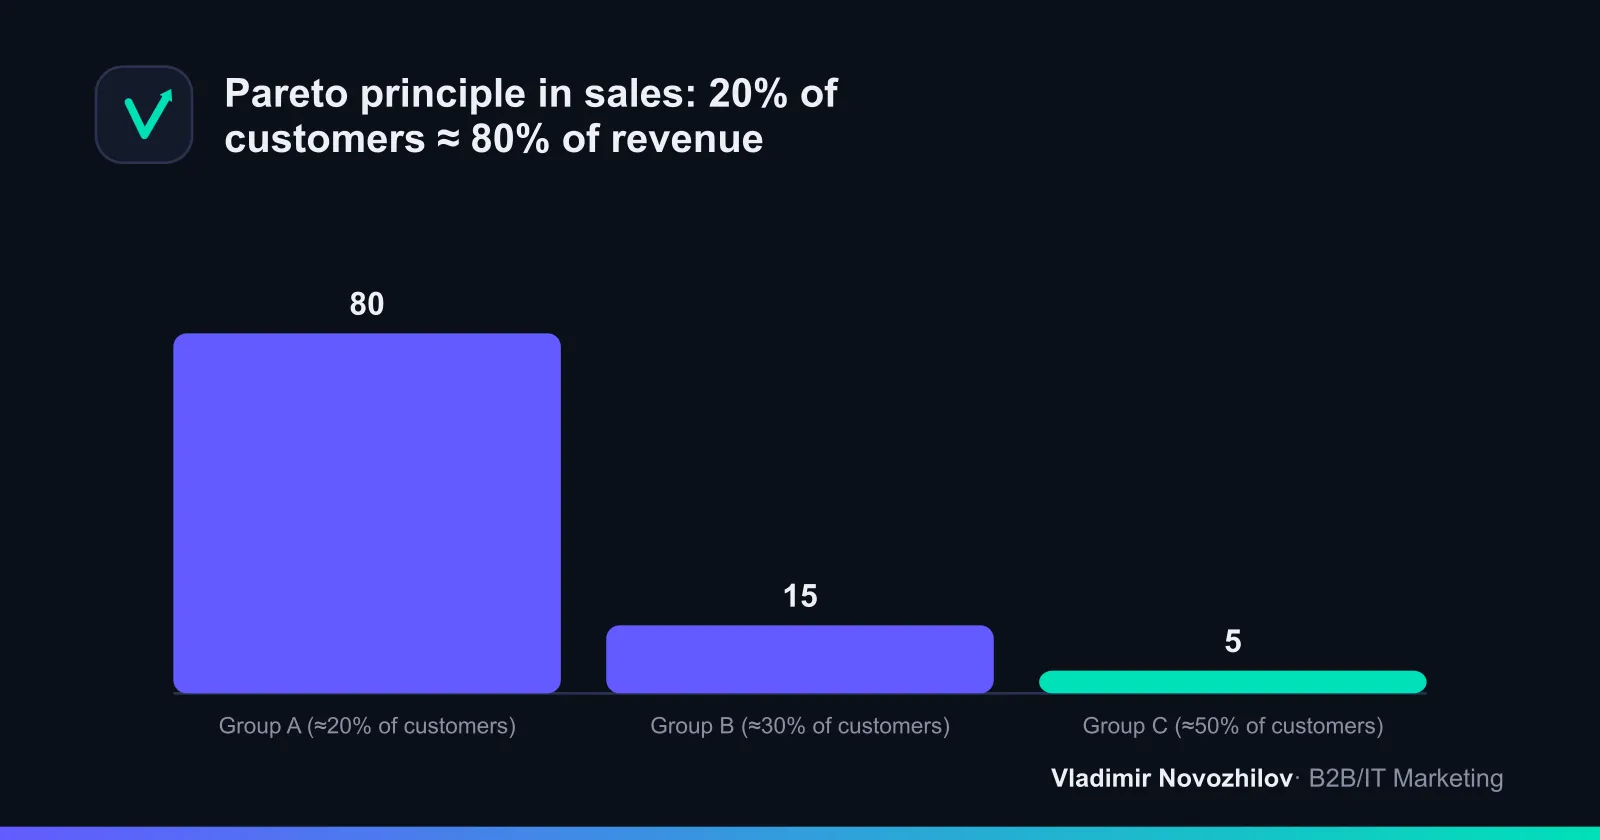
ABC analysis makes sense when there’s noticeable disparity in order value across your base and you have at least 100 active customers. It answers the question ‘who brings in the money,’ but says nothing about stability or loyalty — that’s what XYZ and RFM are for.
How to run ABC customer analysis step by step (with an example and template)
- Export revenue (ideally profit) for each customer over a given period.
- Sort in descending order by amount.
- Calculate each customer’s share of total revenue.
- Calculate the cumulative percentage (running total).
- Assign groups: up to 80% cumulative — A, 80–95% — B, 95–100% — C.
A worked example with five customers (the same customers will run through all three methods):
| Customer | Revenue, $ | Share | Cumulative % | Group |
|---|---|---|---|---|
| Alpha | 600,000 | 50% | 50% | A |
| Bravo | 300,000 | 25% | 75% | A |
| Charlie | 150,000 | 12.5% | 87.5% | B |
| Delta | 100,000 | 8.3% | 95.8% | B |
| Echo | 50,000 | 4.2% | 100% | C |
Total revenue — $1,200,000. Two customers (Alpha and Bravo) generate 75% of the money — this is your group A, which you cannot afford to lose.
XYZ analysis: assessing demand stability
XYZ analysis classifies customers by purchase stability using the coefficient of variation (V). It shows how predictably a customer buys from one period to the next.
Formula: V = (standard deviation of amounts across periods / average amount) × 100%.
- X — V up to 10%: stable, predictable demand.
- Y — V from 10% to 25%: fluctuating demand, some seasonality.
- Z — V over 25%: irregular, random demand.
Example for customer Alpha: over three quarters, they bought $180,000, $210,000, and $210,000 worth. The average is $200,000, the deviation is about $14,142, V ≈ 7% → category X (stable). Customer Echo bought $40,000, $0, and $110,000 — V exceeds 25% → category Z (unpredictable).
For XYZ analysis, the number of comparable periods matters more than the number of customers — use at least 3–4.
Combined ABC/XYZ analysis: how to read the matrix
ABC/XYZ analysis combines value and stability into a 9-cell matrix. It’s more powerful than either method on its own.
| X (stable) | Y (fluctuating) | Z (unpredictable) | |
|---|---|---|---|
| A (high value) | AX — the backbone of the business | AY — important but volatile | AZ — risky: high value, but unstable |
| B (mid value) | BX — reliable mid-tier | BY — grow into A | BZ — handle case by case |
| C (low value) | CX — automate | CY — minimal effort | CZ — candidates to let go |
AX customers are what your service is built for: high value and predictable. AZ is a zone requiring special attention: losing such a customer hits revenue hard, and their behavior is unstable.
RFM analysis: decoding R, F, M and setting thresholds
RFM analysis segments a customer base along three dimensions: Recency (time since the last purchase), Frequency (how often they buy), and Monetary (total amount spent). RFM metrics assess customer behavior, not just size.
- R — Recency: the more recently a customer bought, the higher the score.
- F — Frequency: the more often they buy, the higher the score.
- M — Monetary: the higher total revenue, the higher the score.
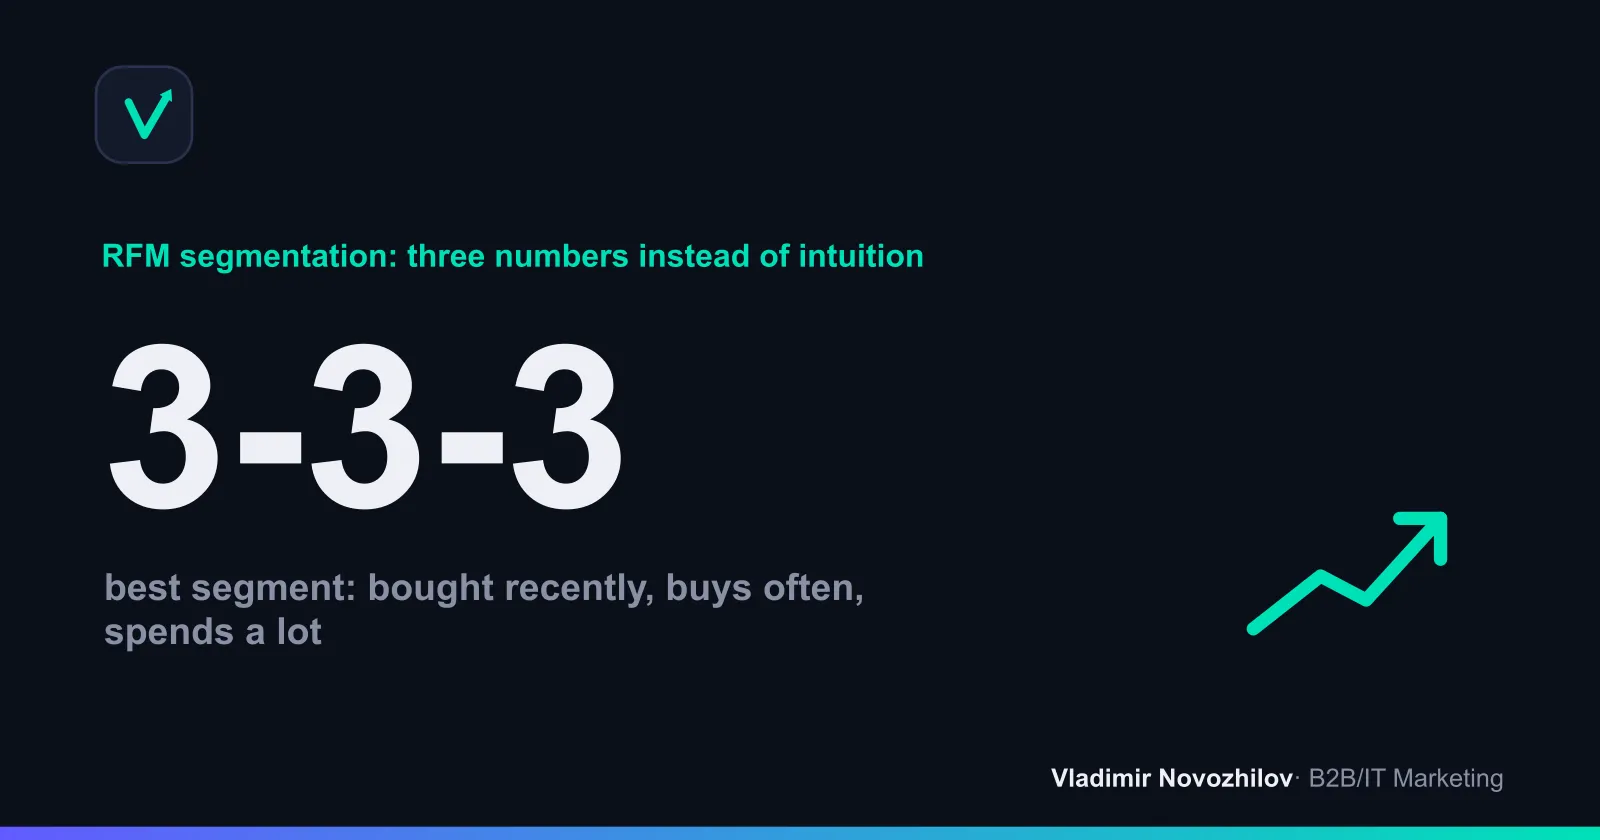
Each metric gets a score on a scale (usually 1–3 or 1–5), where 3 (or 5) is best. Thresholds are set based on quantiles of your own base: split customers into equal groups. For example, for R: purchased in the last 30 days — 3, 31–90 days — 2, more than 90 days — 1.
RFM customer base analysis: a step-by-step algorithm with a calculation example
- Export the date of the last purchase, number of purchases, and total amount for each customer.
- Set thresholds for R, F, and M (based on quantiles or expert judgment).
- Assign scores of 1–3 for each metric.
- Combine them into a segment code (for example, 3-3-3).
- Group customers into clear segments and assign a scenario to each.
RFM customer analysis example, using the same five customers:
| Customer | R (days ago) → score | F (purchases) → score | M ($) → score | Code |
|---|---|---|---|---|
| Alpha | 15 → 3 | 12 → 3 | 600,000 → 3 | 3-3-3 |
| Bravo | 40 → 2 | 8 → 3 | 300,000 → 3 | 2-3-3 |
| Charlie | 20 → 3 | 3 → 2 | 150,000 → 2 | 3-2-2 |
| Delta | 120 → 1 | 5 → 2 | 100,000 → 1 | 1-2-1 |
| Echo | 200 → 1 | 1 → 1 | 50,000 → 1 | 1-1-1 |
Reading the results: Alpha (3-3-3) is a champion; Bravo (2-3-3) is loyal but hasn’t visited in a while — worth a reminder; Delta (1-2-1) and Echo (1-1-1) are at risk of churn or already lost.
Segmenting the customer base: what to do with each segment
RFM segmentation is only useful if the code is followed by action. Here’s a checklist for typical segments:
- Champions (3-3-3): early access to new products, VIP status, ask for referrals. Don’t bombard them with discounts — they’re already buying.
- Loyal customers (x-3-x): loyalty programs, upsells, growing average order value.
- At risk of churn (low R, high F/M): reactivation sequence, personalized offer, a call from a manager.
- Newcomers (high R, low F): onboarding, driving a second purchase, introducing the full product range.
- Dormant / lost customers (1-1-1): cheap mass touchpoints, a win-back campaign; if there’s no response, remove them from active outreach.
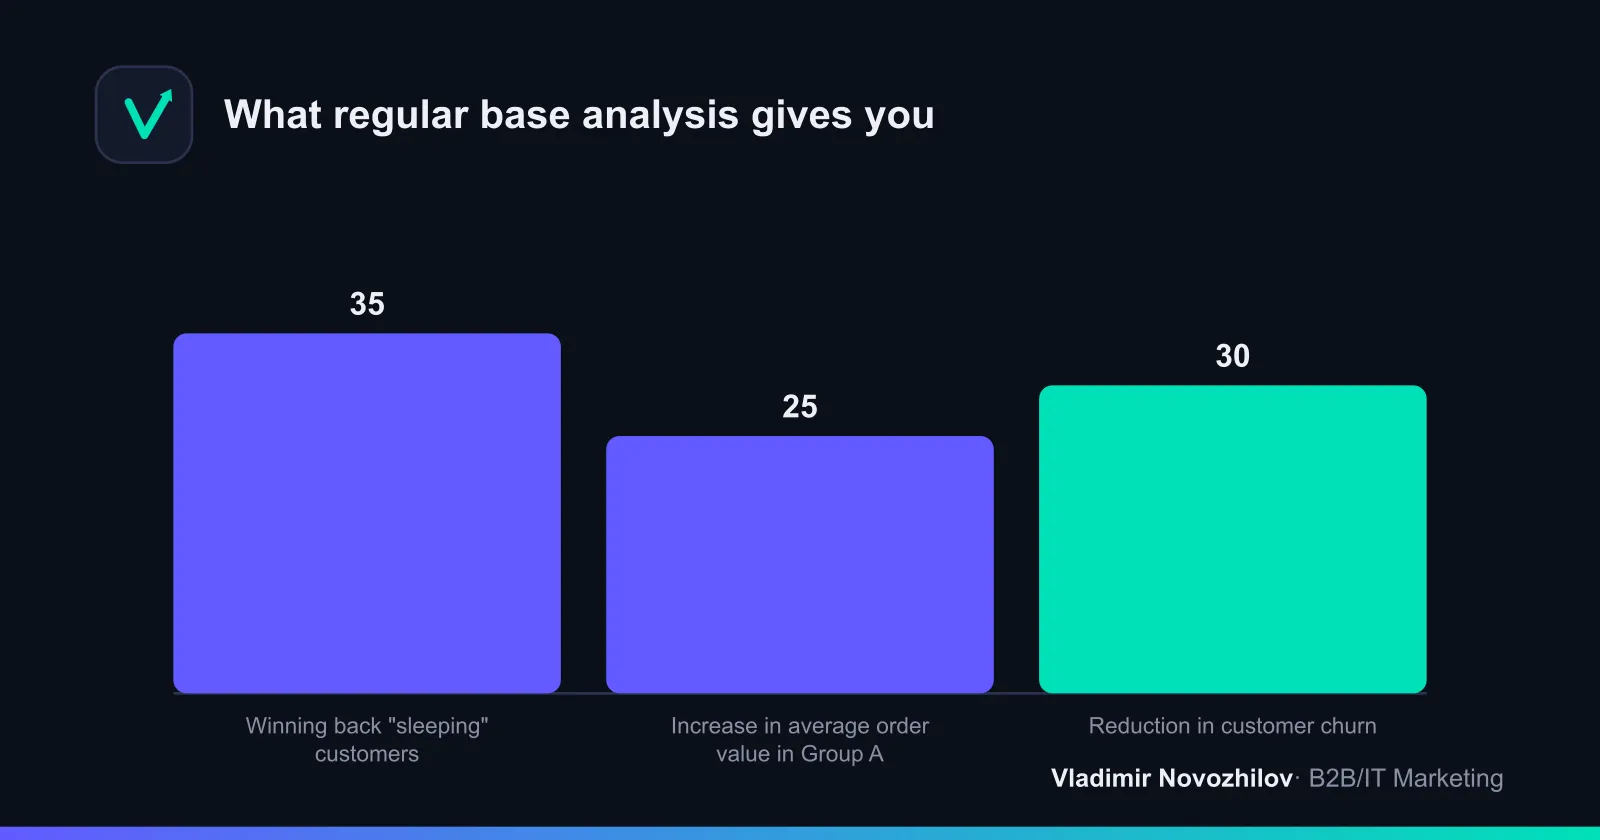
Examples by industry: in services, focus on winning back the ‘at risk of churn’ group through personal contact; in retail, focus on increasing frequency among loyal customers; in B2B, focus on retaining AX customers and protecting against the loss of a single major client.
How to automate analysis in a CRM
A CRM system for analysis eliminates manual work: segments are recalculated automatically, and when a customer’s behavior changes, they automatically move to a different group. What to set up:
- Automatic RFM and ABC calculations on a schedule (monthly/quarterly).
- Trigger-based scenarios: a customer moves into ‘at risk of churn’ → a win-back sequence launches automatically.
- A dashboard tracking segment dynamics and customer churn.
- Integration with email/SMS campaigns and telephony for targeted outreach.
You can start without a CRM — using Excel or Google Sheets with the template above. Add automation once manual recalculation starts eating up too much time.
Common mistakes in customer base analysis
- Calculating by revenue instead of profit. A large customer with discounts and returns can actually be unprofitable.
- Ignoring purchase recency. A customer with high M but R of ‘a year ago’ is nearly churned, not a group A customer.
- Using different calculation windows across periods. Segments stop being comparable.
- Over-fragmenting segments. You can’t realistically serve 125 micro-groups — start with 5–7.
- Analysis without action. A report nobody uses doesn’t generate revenue.
- One-off analysis. Customer base analysis works as a recurring cycle, not a one-time project.
Comparing methods: ABC, XYZ, RFM — which one to choose
| Criterion | ABC analysis | XYZ analysis | RFM analysis |
|---|---|---|---|
| What it measures | Contribution to revenue/profit | Demand stability | Behavior (recency, frequency, monetary) |
| Number of parameters | 1 | 1 | 3 |
| Main question | Who brings in the money | How predictable is demand | Who is leaving and what to offer them |
| Minimum data required | Transaction amounts | 3–4 periods | Dates + amounts + number of purchases |
| Base size | 100+ customers | Periods matter more | 50+ customers |
| Best use case | Prioritization | Planning, procurement | Retention, communication |
How to choose: for quick prioritization — ABC; for planning and risk assessment — ABC/XYZ analysis; for retention scenarios and fighting churn — RFM. Ideally, combine them: ABC shows who you can’t afford to lose, XYZ shows who’s unstable, and RFM shows exactly how to work with them. This combination of customer base analysis methods gives you a complete picture and protects revenue from unexpected drops.
FAQ
- What customer base size do you need for ABC and XYZ analysis?
- For reliable ABC customer analysis, you need at least 100 active customers and 3–6 months of purchase history. For XYZ analysis, the number of customers matters less than the depth of periods: you need at least 3–4 comparable intervals (months, quarters), otherwise the coefficient of variation won't be calculated correctly. With fewer than 50 customers, the methods still work, but draw conclusions carefully.
- How often should you run RFM analysis on your customer base?
- Frequency depends on the purchase cycle. In retail and services with frequent repeat transactions, RFM analysis is updated monthly. In B2B with a long sales cycle, quarterly is enough. The key is to calculate over a consistent window (for example, a rolling 12 months) so segments stay comparable across periods and you can track customers moving between groups.
- What's the difference between ABC analysis and RFM analysis?
- ABC analysis ranks customers by a single parameter — contribution to revenue or profit — and answers the question 'who brings in the money.' RFM analysis factors in three metrics (recency, frequency, and monetary value) and answers the question 'how does the customer behave, and are they at risk of leaving.' ABC is great for prioritization, RFM for communication scenarios and churn prevention.
- Can you analyze a customer base in Excel without a CRM?
- Yes. For ABC/XYZ and RFM, a simple export of transactions with customer, date, and amount fields is enough. In Excel or Google Sheets you calculate total revenue, share, cumulative percentage (ABC), coefficient of variation (XYZ), and three R/F/M scores. A CRM system speeds up the process and automates recalculation, but it's not required to get started.
- Which metric matters most in customer base analysis?
- There's no single 'most important' metric — what matters is combining them. To assess value, look at customer CLV and profit contribution (ABC); for revenue stability, look at demand consistency (XYZ); for retention, look at purchase recency and customer churn (RFM). If you had to pick one benchmark, use profit per customer rather than revenue — it protects you from 'expensive but unprofitable' customers.