Competitor Analysis Table: Template and Example


TL;DR
A competitor analysis table is a structured comparison of companies using consistent criteria (pricing, product, channels, market share, strengths and weaknesses). This article provides a ready-to-use template for Excel and Google Sheets, a step-by-step checklist, industry-specific variations, and a fully completed example with numbers and strategic takeaways.
Competitor analysis often drowns in chaos: notes in a notebook, screenshots of other people’s websites, scattered figures in chat threads. None of this is useful until it’s consolidated into a single format. Competitor analysis in a table solves exactly this problem — it turns raw observations into a management tool that clearly shows where you’re winning and where you’re falling behind.
Below is a ready-made competitor analysis table template, comparison criteria, a step-by-step guide, industry-specific variations, and a fully completed example with real numbers. All of this can be assembled in Excel or Google Sheets in a single workday.
What a competitor analysis table is and why you need one
A competitor analysis table is a structured comparison of several companies against a common set of criteria: prices, product, promotion channels, market share, strengths and weaknesses. The rows contain comparison parameters, the columns contain competitors (plus, always, your own company as a baseline).
Why this matters in practice:
- Pricing. You can see the market’s real price corridor — where you’re overpriced for no reason, and where you’re underselling yourself.
- Product. It becomes clear which features and terms have become industry standard, and what can be turned into differentiation.
- Marketing. You see which channels competitors use to get traffic and customers, and where there are unoccupied niches.
- Positioning. The table shows how you’re objectively different, not how you’d like to be different.
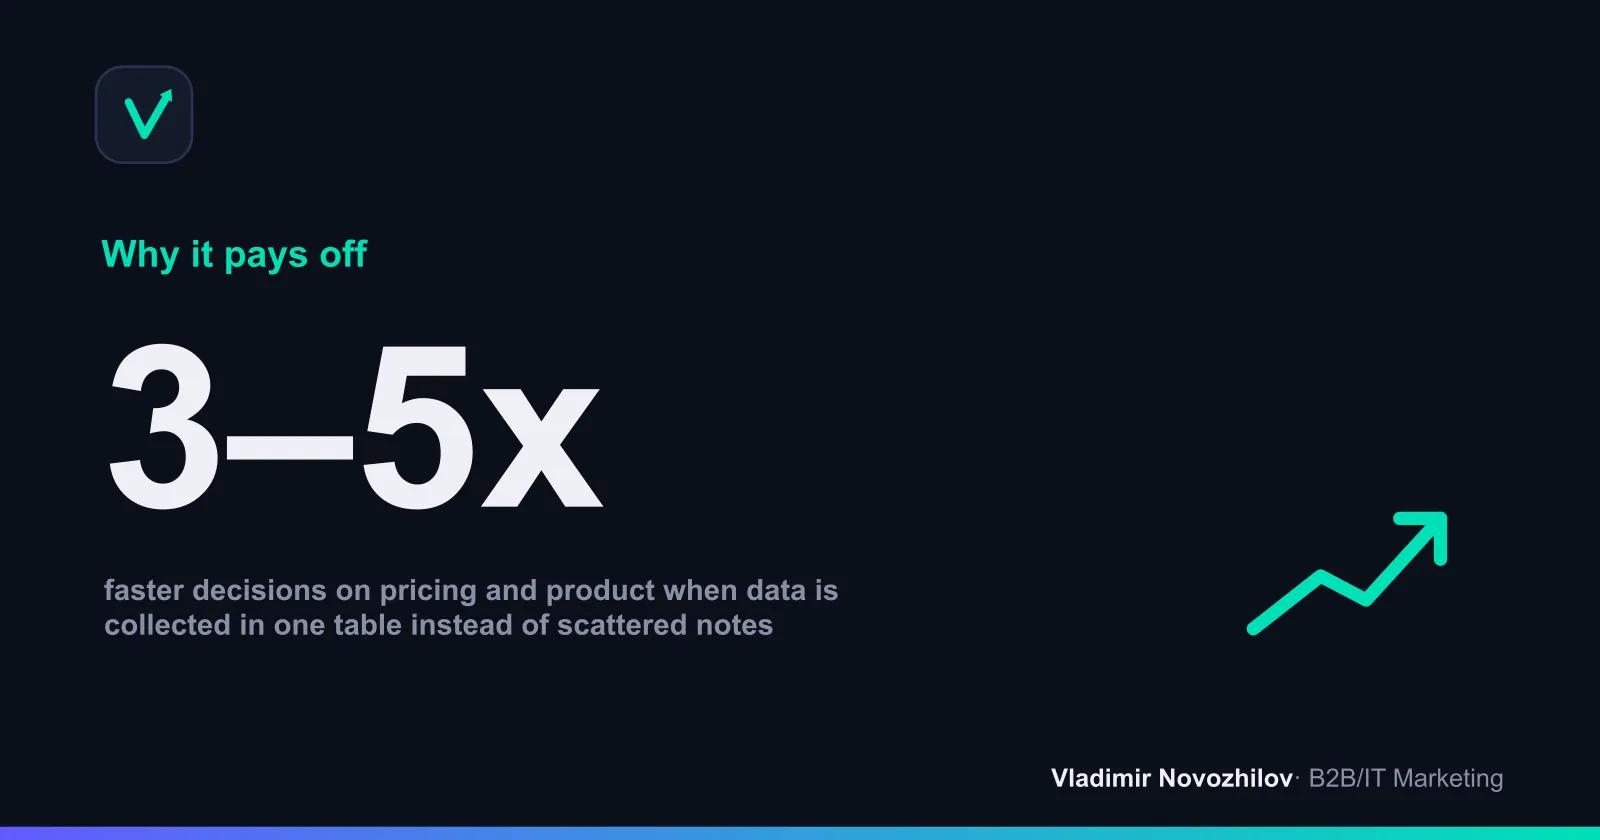
The main value isn’t the act of collecting data — it’s the decisions you make based on it. That’s why every competitor analysis table should end with a “Conclusion / next steps” column.
The difference between a table, a SWOT analysis, and a competitive matrix
These three tools are often confused. In reality, they complement each other and solve different problems.
| Tool | What it shows | When to use it |
|---|---|---|
| Comparison table | Horizontal comparison of many companies against common criteria | Basic market review, price and product evaluation |
| SWOT analysis | Strengths/weaknesses, opportunities and threats of one company | Deep dive into a single player or yourself |
| Competitive matrix | Player positions along 2 key axes (market map) | Finding open niches and points of differentiation |
Beyond these, competitive analysis also uses SNW analysis (Strength–Neutral–Weakness — assessing positions as “stronger / on par / weaker than the market”) and Porter’s Five Forces (competitors, new entrants, suppliers, buyers, substitute products). To gather criteria, the classic marketing frameworks are useful — the 4P model (product, price, place, promotion) and the 5C model (company, customers, competitors, collaborators, context).
A practical sequence: first collect data in a comparison table, then run a SWOT on the 2–3 key players, and finally visualize the result with a competitive matrix.
What blocks make up an effective competitor analysis table
A universal competitor comparison table consists of several logical blocks. There’s no need to overload it with a hundred rows — 8–12 meaningful criteria are enough.
- General information: name, website, year founded, region of operation.
- Product and services: range, key features, quality.
- Price and terms: pricing, discounts, contract terms, payment methods.
- USP and positioning: unique selling proposition, key promise.
- Target audience: who the product is for, segments.
- Promotion channels: SEO, paid search, social media, affiliates, offline.
- Market metrics: market share, traffic, reach, reviews, rating.
- Strengths and weaknesses: brief notes for each player.
- Conclusion: what this means for us and what action follows.
The emphasis varies by market: in B2B and services, product, expertise, and contract terms take priority; in e-commerce, it’s price and delivery speed.
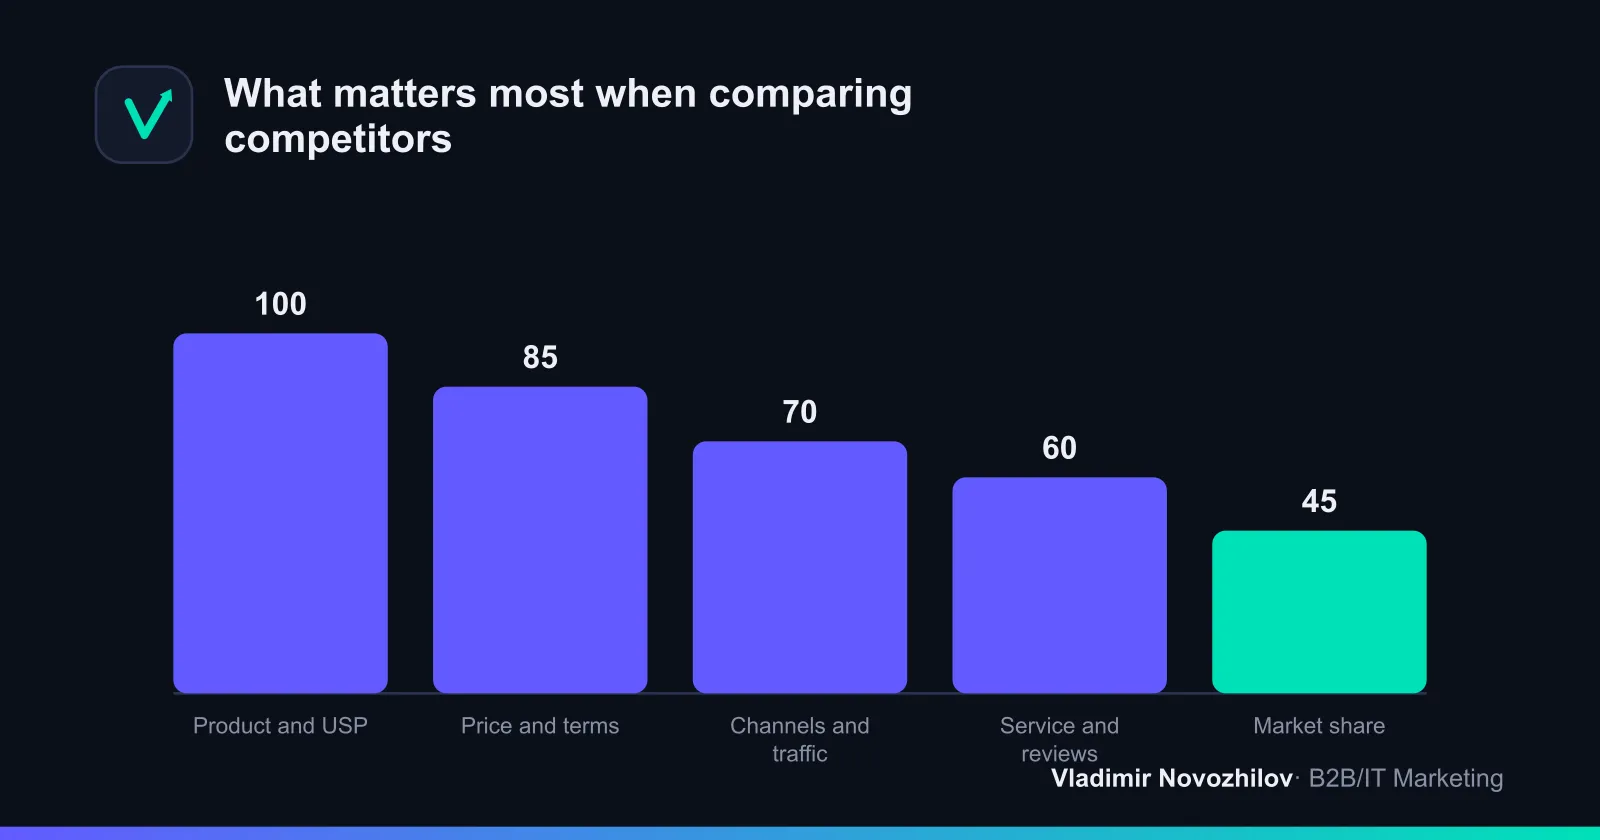
Key criteria and metrics for comparing competitors
Criteria are the heart of the table. Below is a base set of 9 parameters suitable for most markets in B2B, IT, and services.
| Criterion | What we’re assessing | Where to get the data |
|---|---|---|
| Pricing policy | Price level, range, discounts | Website, price lists, proposals |
| Product / service | Features, quality, range | Website, demos, reviews, mystery shopping |
| USP | Key promise to the customer | Homepage, ads |
| Target audience | Segments, niches | Case studies, reviews, social media |
| Promotion channels | Traffic and lead sources | SimilarWeb, SEMrush, Ahrefs |
| Market share / traffic | Reach, visits | Public reports, analytics |
| Service | Response speed, support | Test inquiry, reviews |
| Reputation | Rating, NPS, reviews | Review sites, maps, social media |
| Strengths/weaknesses | Overall assessment | Your own synthesis |
For product and subscription businesses, the list is expanded with economic metrics: CAC (customer acquisition cost), LTV (lifetime value), churn rate, and NPS (net promoter score). You won’t get exact figures for competitors, but indirect signals (frequency of promotions, retention programs, churn-related complaints) let you estimate the order of magnitude and note it as a hypothesis.
Tip: assign each criterion a weight (say, 1 to 3) and a score on a 1–5 scale. That turns the table into a scoring model, giving you a composite score for each competitor rather than just a set of observations.
Step-by-step guide: how to build a competitor analysis table
A checklist for building a competitor table — from setting the goal to drawing conclusions.
- Define the goal. For example: “understand why customers are leaving” or “choose a price for a new plan.” The goal dictates the set of criteria.
- Select competitors. 5–7 companies: direct, indirect, potential (more on this below).
- Set the criteria. 8–12 parameters from the block above. No more — otherwise the table will stop being updated. To avoid missing anything, check the list of competitor analysis questions.
- Assign weights and a scale. Rank the importance of criteria and set a 1–5 scoring scale.
- Collect data. Websites, price lists, reviews, test inquiries, analytics tools. Record the source and date.
- Enter it into the table. Criteria in rows, competitors and your company in columns.
- Assign scores. Calculate a composite score for each player.
- Draw conclusions. In a separate column, note specific actions: where to cut prices, what to improve in the product, which channel to test.
- Set the next update date. And assign an owner.
The entire cycle for a mid-sized market takes 1–2 workdays. After that, it’s just maintenance.
How to choose competitors for analysis
A common beginner mistake is comparing yourself only to obvious market leaders. A proper selection accounts for three types of players:
- Direct competitors — offer the same product to the same audience. Analyze them in detail; they form the core of the table.
- Indirect competitors — solve the same customer problem in a different way. For example, for an SEO agency, an indirect competitor is an in-house marketer on the client’s staff.
- Potential competitors — adjacent players who could enter your market. Keep them on your radar, but analyze them only superficially.
Where to look: search results for key queries, ad placements, review sites and aggregators, and customer questions like “how are you different from…” The optimal table composition is 3–4 direct, 1–2 indirect, and 1 potential competitor, plus yourself.
Ready-made competitor analysis table template
You can assemble a competitor analysis template in Excel or Google Sheets in 10 minutes. Below is the structure — just copy it into the header row and first column of your table.
| Criterion | Weight (1–3) | Us | Competitor A | Competitor B | Competitor C |
|---|---|---|---|---|---|
| Price (level) | 3 | ||||
| Product / features | 3 | ||||
| USP | 2 | ||||
| Target audience | 1 | ||||
| Promotion channels | 2 | ||||
| Traffic / market share | 2 | ||||
| Service and support | 2 | ||||
| Rating / reviews | 1 | ||||
| Composite score | |||||
| Conclusion / action |
To have a Google Sheets template calculate the composite score automatically, score on a 1–5 scale and use a formula in the “Composite score” row that sums the products of scores and weights. In Excel, this is the SUMPRODUCT function applied to the score and weight ranges. That way, the competitor comparison table instantly ranks the players.
Industry variations of the table
The base template adapts to any niche by swapping out some of the criteria. Below is what to add for different fields.
| Industry | Key criteria beyond the base set |
|---|---|
| B2B and services | Industry expertise, case studies, contract terms, timelines, dedicated account manager |
| IT and products | Functionality, integrations, pricing tiers, support, roadmap |
| E-commerce | Price, availability, delivery speed, returns, product rating |
| Marketplaces | Search ranking, seller rating, reviews, sales volume, repricing |
For marketplace sellers, the table is usually built around price and rating: competitors’ listings are compared by price, review count, and search position, and prices are adjusted accordingly. In B2B, the emphasis shifts to trust: case studies, client reviews, and demonstrated industry expertise.
Example of a filled-in competitor analysis table with numbers
Let’s walk through a worked example for a hypothetical web development agency. Scores are on a 1–5 scale, with weights already factored into the composite score.
| Criterion (weight) | Us | Competitor A | Competitor B |
|---|---|---|---|
| Price, per project (3) | from $4,000 / 4 | from $5,700 / 3 | from $2,300 / 5 |
| Product / stack (3) | Web + mobile / 5 | Web only / 3 | Template sites / 2 |
| USP (2) | 6-week turnaround / 4 | Enterprise clients / 5 | Cheap and fast / 3 |
| Channels (2) | SEO + content / 3 | Paid search + PR / 5 | Social media / 3 |
| Monthly traffic (2) | 12k / 3 | 45k / 5 | 8k / 2 |
| Review rating (1) | 4.8 / 5 | 4.6 / 4 | 4.1 / 3 |
| Composite score | 41 | 44 | 33 |
Conclusions from the table:
- Competitor A is stronger in traffic and enterprise client work, but pricier. Our growth area is boosting inbound marketing and winning more premium projects.
- Competitor B undercuts on price but falls short on product. We shouldn’t follow their pricing down — that would erode margin; instead, we should emphasize the quality and stack difference.
- Our advantage is turnaround time and a broader stack (web + mobile). That’s what should anchor our USP and positioning.
A single completed table produced three concrete decisions on pricing, product, and marketing — which is exactly the point of building one.
Competitor map: visualizing positions
A competitive matrix (competitor map) translates the table into a visual picture. Pick 2 meaningful axes — for example, “price” and “range of products” — and plot the players across four quadrants.
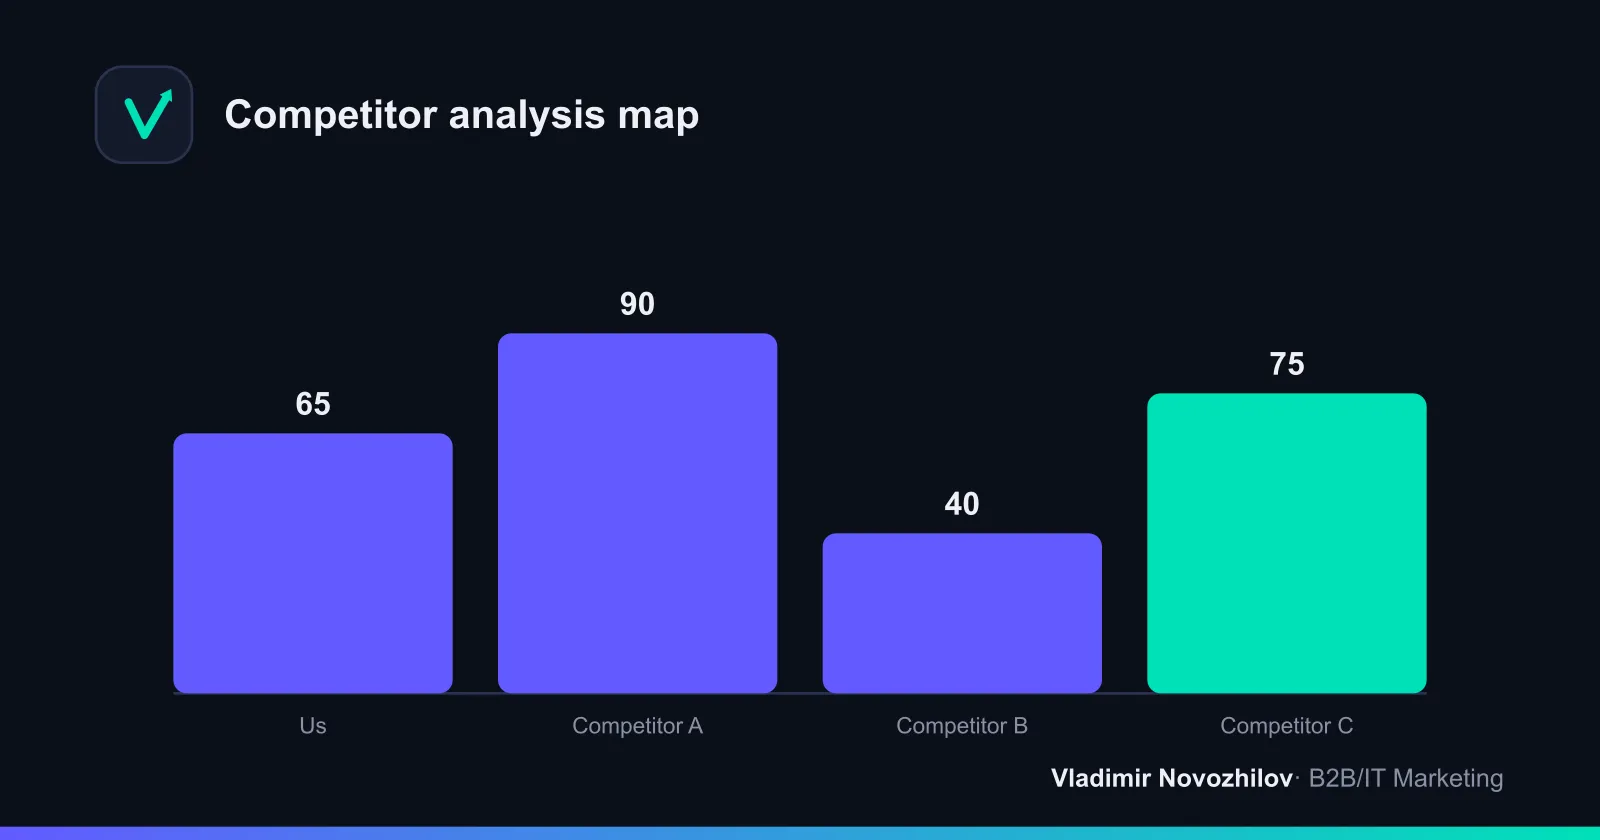
The map instantly reveals open zones in the market. If the “high quality / mid-price” quadrant is empty but demand exists there, that’s a positioning hypothesis worth testing. Choose axes that genuinely matter to the customer’s decision, not just ones that are convenient to measure.
How to use the table’s data in your strategy
A table without action is a dead document. Here’s how to turn it into decisions:
- Pricing. Compare your price list to the market corridor. If you’re in the top third without a clear advantage, either boost perceived value or adjust the price.
- Product. Identify features everyone has (market hygiene) and features no one has (potential differentiation).
- Marketing. Find channels competitors are underusing — acquisition costs there tend to be lower.
- Positioning. Build your message around the areas where your composite score is objectively higher.
A good habit is to write down 3 priority actions for the quarter after every table update. This keeps the analysis disciplined and stops it from becoming an end in itself.
Automation: tools for collecting competitor data
Manually filling in the table takes time, especially if prices change often. Some data can be collected automatically.
| Task | Tools | What it provides |
|---|---|---|
| Traffic and sources | SimilarWeb, SEMrush, Ahrefs | Estimates of competitor traffic and channels |
| SEO and keywords | SEMrush, Ahrefs | Search visibility, keywords, backlinks |
| Price monitoring | Repricers and price-scraping tools | Tracking prices and promotions |
| Table storage | Google Sheets, Excel | Collaboration and scoring formulas |
Comparing the two approaches:
| Parameter | Manual entry | Specialized tools |
|---|---|---|
| Cost | Free, but time-intensive | Paid subscription |
| Speed | Slow | Fast, on a schedule |
| Numerical accuracy | Approximate | Higher for traffic and rankings |
| Qualitative assessment | Strong (humans catch nuance) | Weak |
The best approach is a hybrid: pull quantitative data (traffic, prices, rankings) from tools, and assess qualitative aspects (USP, service, product impressions) manually.
Common mistakes when filling in a competitor table
- Too many criteria. Nobody will update 30 rows. Keep it to the 8–12 that matter.
- Your own company isn’t in the table. Without a baseline, the comparison is meaningless.
- Scores without a source or date. A month later, it’s unclear where the number came from or how fresh it is.
- Analysis for analysis’s sake. No conclusion or action column means the table is useless.
- Comparing only against leaders. Ignoring indirect and potential competitors creates blind spots.
- One-off treatment. The market keeps changing, but the table stays frozen at its creation date.
How often to update a competitor analysis table
Base rhythm: a full review once a quarter. Prices and promotions in fast-moving niches — monthly or weekly, ideally automated. Positioning and product range — every six months. Always record the date of the last update and the person responsible directly in the table — that’s what keeps it a living working tool rather than an archive.
Systematic competitive analysis isn’t a one-time study — it’s a habit. A table built once pays for itself many times over: every pricing, product, and promotion decision you make is grounded in facts, not gut feeling.
FAQ
- How do I build a competitor analysis table from scratch?
- Define the purpose of the analysis, select 5–7 competitors (direct, indirect, and potential), set 8–12 comparison criteria (price, product, channels, USP, market share, strengths and weaknesses), gather data from public sources and tools, enter it into a single table, and add a column for conclusions. The easiest way to start is with a ready-made template in Google Sheets or Excel.
- How many competitors should be included in the analysis table?
- The optimal number is 5–7 companies: 3–4 direct competitors, 1–2 indirect ones, and 1 potential competitor. Fewer than three gives an incomplete market picture, while more than ten makes the table unwieldy and hard to keep current. Always include your own company as a baseline.
- How is a competitor analysis table different from a SWOT analysis?
- A table is a horizontal comparison of several companies against common criteria, answering the question 'who is stronger, and in what.' A SWOT analysis focuses on a single company and breaks down its strengths, weaknesses, opportunities, and threats. In practice, the two are combined: the table supplies the data, and SWOT provides the interpretation for each player.
- What criteria must be included in a competitor analysis table?
- The minimum set includes pricing policy, product range and features, unique selling proposition, target audience, promotion channels, market share or traffic, service quality, and reviews. For B2B and services, add contract terms, timelines, and industry expertise; for e-commerce, add product rating and delivery speed.
- How often should a competitor table be updated?
- A baseline refresh should happen once a quarter. In highly competitive niches, prices and promotions should be tracked monthly or weekly, ideally through automated monitoring tools. Positioning, product range, and strategy can be reviewed every six months. Record the date of the last update directly in the table.