Analyzing Competitors' Social Media Content: A Methodology


TL;DR
Competitor content analysis is a systematic review of rivals' posts, engagement, promotion, and communication to find working formats and strengthen your own content strategy. We break it down into three blocks—content, promotion, communication—and cover ER metrics, the A+/D Grades scoring system, a tool comparison table, and a report template.
Analyzing competitors’ content isn’t about peeking at someone else’s posts and copying whatever worked. It’s a systematic collection of data on what rivals publish, how, and with what results, so you can make decisions about your own content strategy based on facts rather than guesses. This article lays out a step-by-step methodology: how to find competitors, which metrics to track, how to score posts using the Grades system, which tools to use, and how to structure your findings so they turn into a content plan and ad creatives.
Unlike general competitive analysis guides, this one focuses specifically on social media: content, promotion, and communication. We’ll also mention classic methods like SWOT analysis and positioning maps — but as a framework, not the main body of work.
What competitor content analysis is and why you need it
Competitor content analysis is a review of competing accounts’ publications, engagement, promotion, and communication aimed at finding working formats, rivals’ weak spots, and growth opportunities for yourself. In simple terms, you’re answering three questions: what competitors publish, how they promote it, and how they communicate with their audience.
Why this matters for B2B, IT, and service businesses:
- Shortcut trial and error. Competitors have already spent budget testing formats — you see the results for free.
- Find market gaps. If everyone writes about features and no one covers implementation and support, that’s your niche.
- Gather benchmarks. Understand what ER, posting frequency, and reach are considered normal in your niche.
- Boost sales. Social media content sits at the top and middle of the sales funnel. Understanding how competitors warm up their audience helps you build your own touchpoint sequence.
It’s important to distinguish two levels from the start. Community and content metrics (likes, followers, ER) are not business metrics. A high number of reactions doesn’t equal revenue. That’s why social media content analysis should always be tied to sales hypotheses, not evaluated in a vacuum.
How to find competitors to analyze on social media
Before starting your competitor social media analysis, build a proper list. A common beginner mistake is including only obvious market leaders whose budgets are nowhere near yours.
Split competitors into three types:
- Direct competitors — offer the same product to the same audience (two web development agencies in the same city).
- Indirect competitors — solve the same customer problem a different way (a freelancer vs. an agency, an off-the-shelf solution vs. custom development).
- Substitute competitors — capture the audience’s attention and budget in adjacent topics (an expert blogger, an industry media outlet, an info product).
Step-by-step instructions for finding competitors on social media:
- List 5–10 key search queries people use to find you, and search for them within the platforms.
- Use hashtag and geotag search within your niche.
- Check who your target audience and industry opinion leaders follow.
- Check platform ad libraries to see who’s actively running ads on your topics.
- Use SimilarWeb or similar services to find sites with overlapping audiences.
- Ask your own clients who they considered before choosing you.
For an SMM strategy, 3–5 direct competitors and 2–3 indirect/substitute accounts are enough. That’s sufficient to spot patterns without drowning in data.
Criteria and evaluation blocks: content, promotion, communication
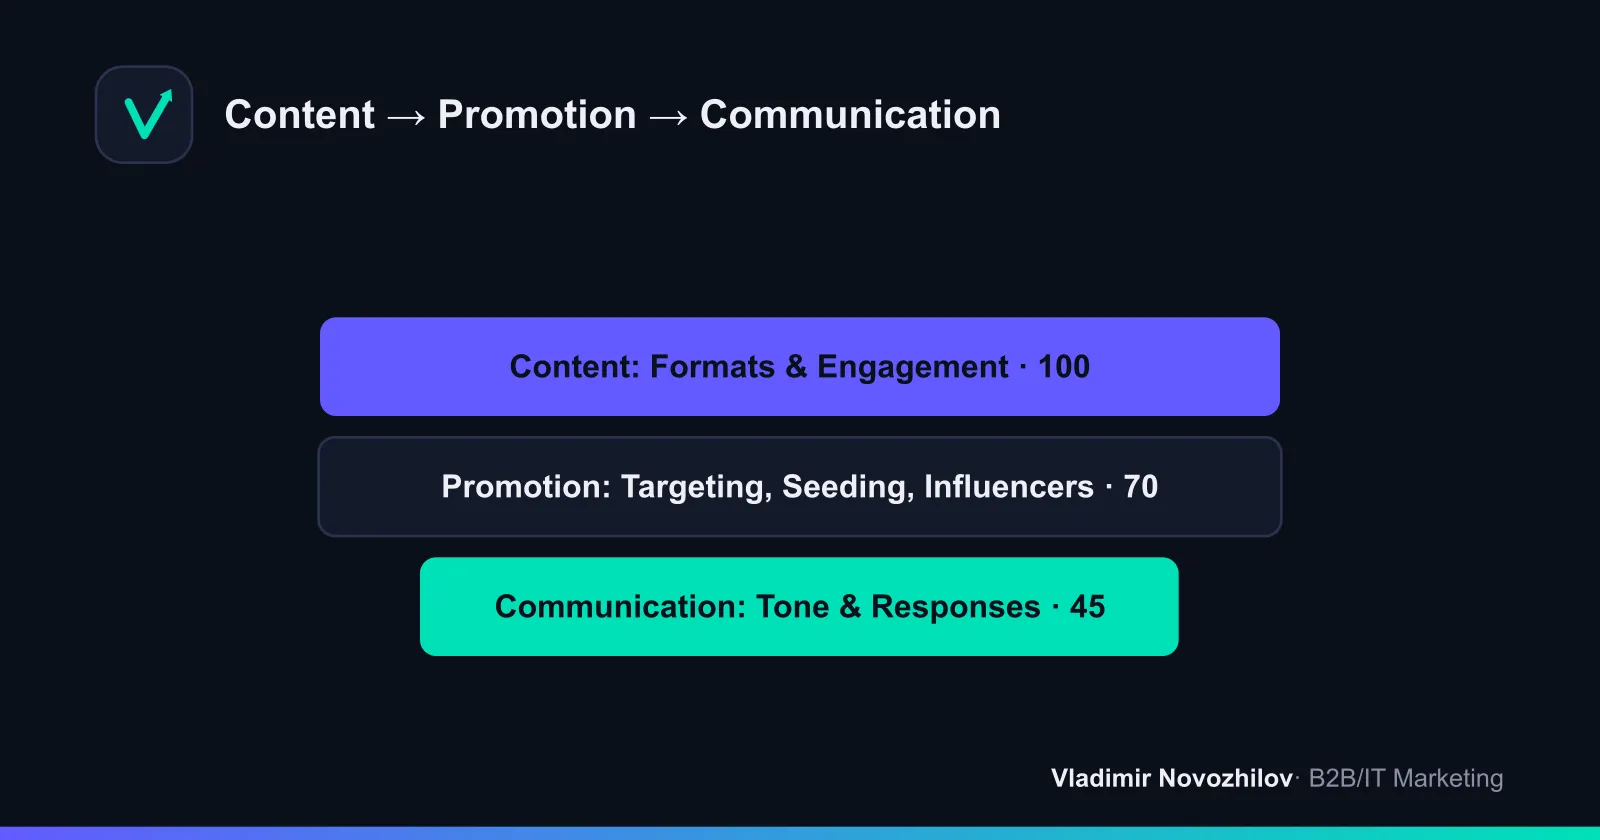
To make your competitor social media analysis systematic, break it into three blocks. This is a handy checklist to run through for each competitor in turn.
Block 1. Content
- Formats: posts, videos, carousels, stories, long reads, live streams.
- Categories and topics: expert content, sales content, entertainment, engagement-driven.
- Posting frequency and timing.
- Visual style and tone of voice.
- ER and engagement metrics, reach, reaction ratios.
Block 2. Promotion
- Presence and types of paid social ads.
- Seeding in niche communities.
- Work with bloggers and ambassadors.
- Follower growth dynamics (organic or bought).
Block 3. Communication
- Tone of communication in comments and replies.
- Response speed and quality.
- Handling of negativity and objections.
- Presence of chatbots, newsletters, welcome messages.
It’s convenient to turn this checklist of criteria for analyzing competitors’ content and social media into a table, with competitors as rows and these parameters as columns. This kind of comparative competitor analysis immediately shows who’s strong at what.
Competitor content analysis: which posts and metrics to check
The biggest mistake in analyzing competitors’ posts is looking only at publications with the highest engagement. Top posts are often atypical: a giveaway, a meme, or a news hook you can’t replicate. It’s far more useful to analyze the full body of content and find patterns.
What to check for each post:
- Format and topic — what exactly was published.
- Reactions — likes, saves, shares.
- Comments — genuine dialogue or bot-driven activity.
- Views and reach — how many people saw it.
- Call to action — is there a sales-oriented element.
Also evaluate not just the highest-performing posts but the lowest-performing ones. Flops say just as much as successes: they show which topics the competitor’s audience rejects. This protects you from repeating someone else’s mistakes.
ER and engagement metrics: what they actually show
ER (engagement rate) is a coefficient showing the share of the audience that reacted to content. It’s the key metric when analyzing competitors’ engagement. It’s calculated in two ways:
- ERpost = (likes + comments + shares) / post reach × 100%. Shows how well a specific post performed.
- ERday = total reactions per day / number of followers × 100%. Shows overall account activity.
Why ER matters more than follower count: an account with 50,000 followers and an ER of 0.3% is less healthy than a channel with 5,000 followers and an ER of 6%. ER and engagement metrics reflect audience quality, not just size.
That said, keep in mind: engagement is top of the funnel. It doesn’t guarantee sales. High ER on entertainment content might not convert into leads at all. So always tie the numbers to the type of content.
The Grades scoring system (A+/D) and handling outliers
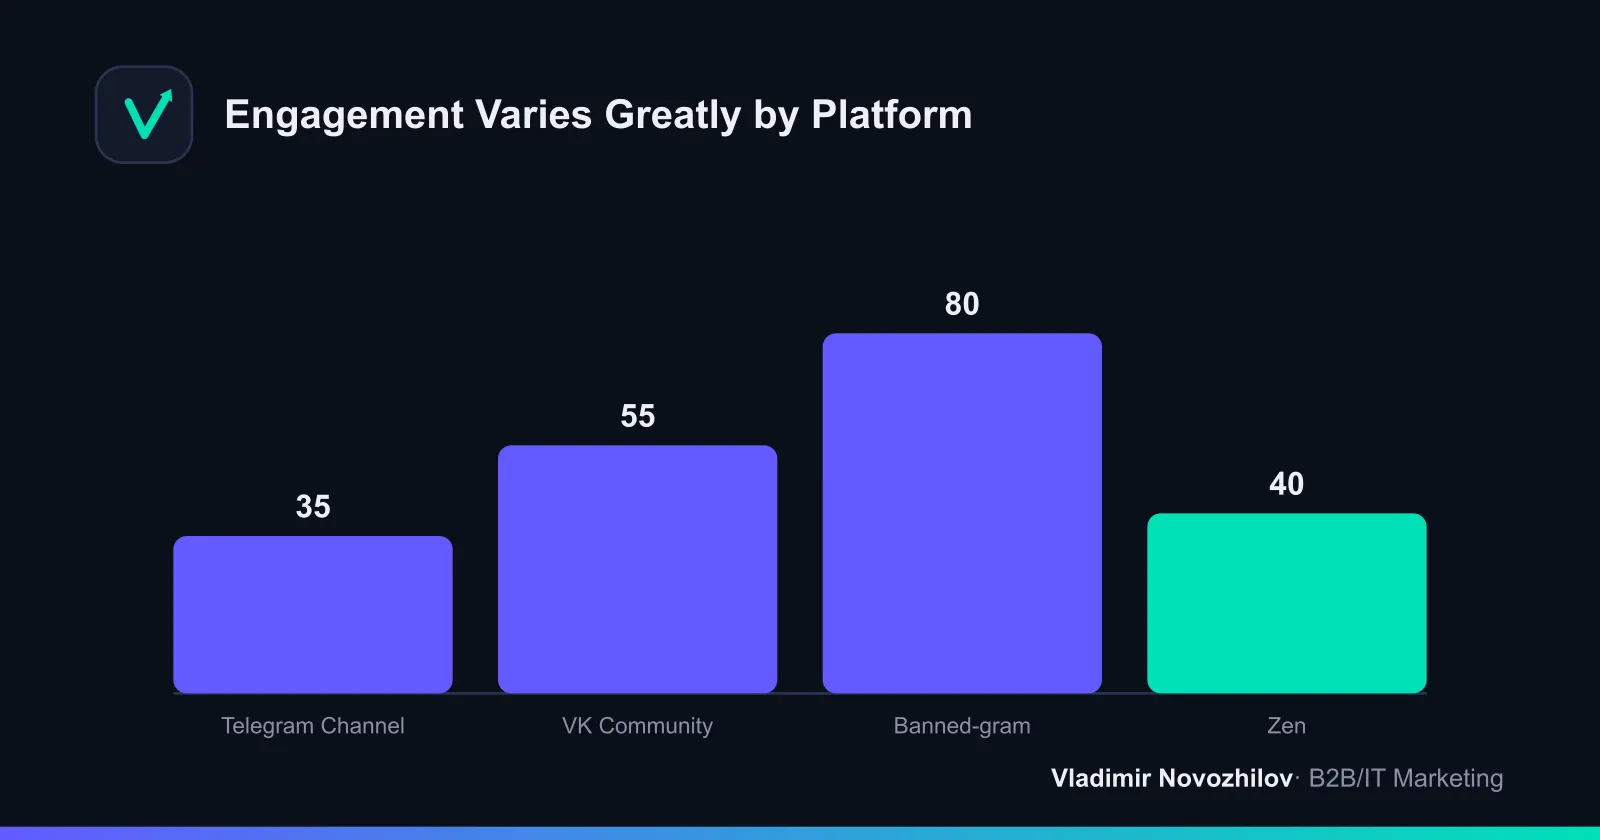
To avoid drowning in hundreds of posts, use the Grades system — ranking publications from A+ (best) to D (worst) within a single metric. Grades are assigned separately for reactions, comments, and views, because the same post can be A+ for views and D for comments.
How this works in practice:
- Export all of a competitor’s posts for a period (3–6 months) into a spreadsheet.
- Sort by metric (for example, by number of comments).
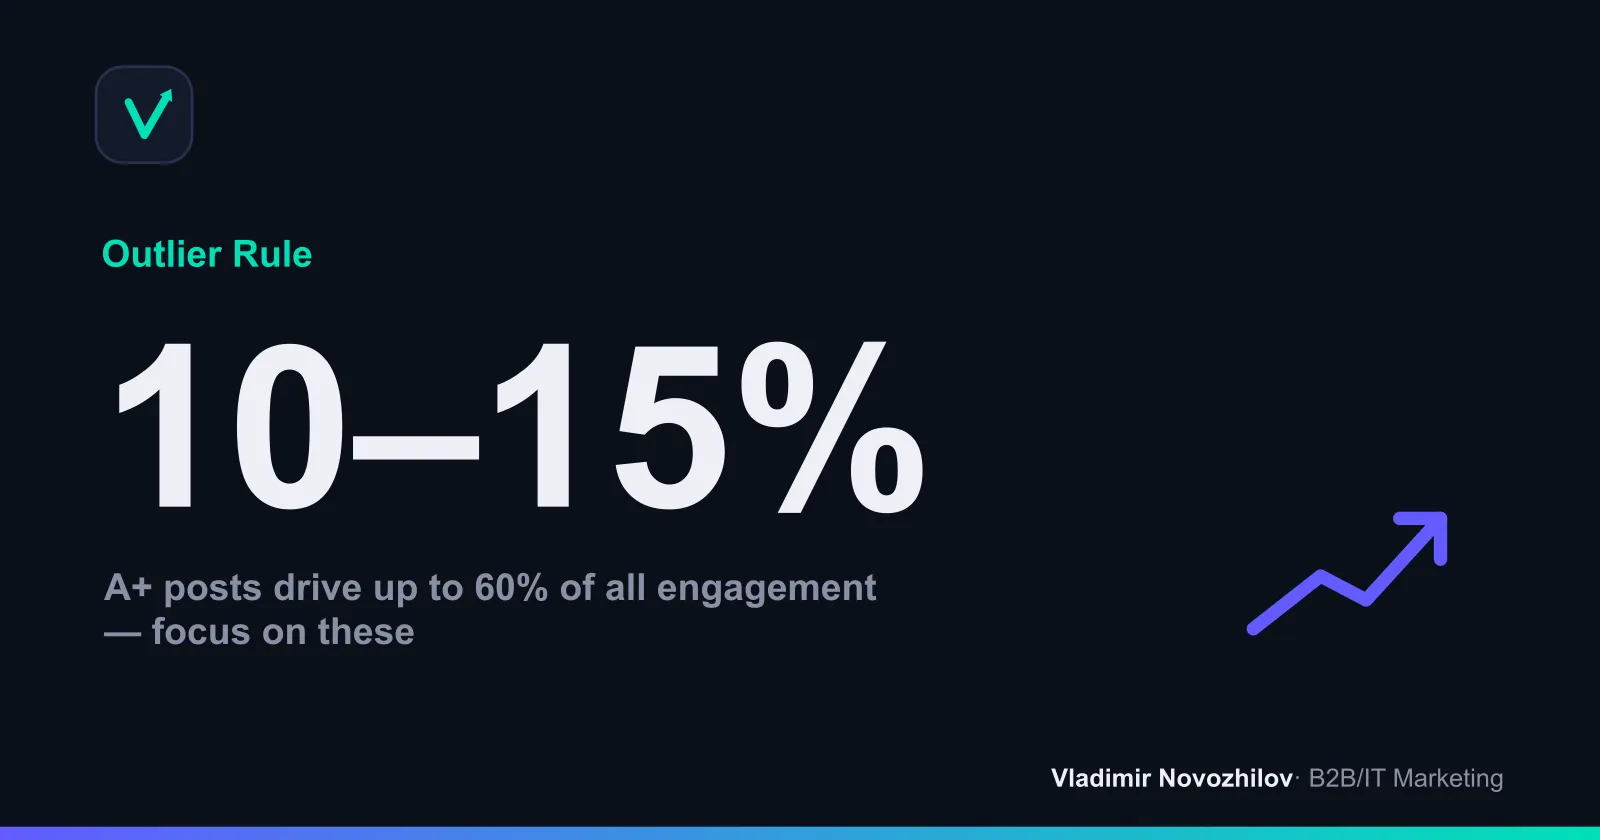
- Split into groups: the top ~10–15% get A+, the next tier gets A, then B, C, and the bottom gets D.
- Analyze what A+ posts have in common, and what D posts have in common.
A sample breakdown of Grades for clarity:
| Grade | Share of posts | What it means | What to do |
|---|---|---|---|
| A+ | Top 10% | Flagship formats, best response | Adapt into your content plan |
| A / B | 40% | Consistently solid content | Use as the base for your content categories |
| C | 35% | Average posts | Test reworking them |
| D | Bottom 15% | Flops, audience ignores | Don’t repeat |
Handling outliers is a separate rule. If one post got 20x more reactions because of a giveaway, exclude it from your averages, or it will skew competitor content benchmarks. The median is more honest than the mean here.
Mini case study: a channel in the B2B services niche
When analyzing a consulting company’s Telegram channel (around 4,000 subscribers) using the Grades system, it turned out that A+ posts by comments were breakdowns of client mistakes and provocative statements, while D posts were webinar announcements and corporate news. Conclusion for the content plan: increase the share of case breakdowns ending with an open question, and post announcements less often with a more personal tone. Over two months, the average number of comments per post grew from 3 to 11 — nearly a 4x increase in engagement with no added budget.
Analyzing competitors’ promotion: ads, seeding, bloggers
Analyzing competitors’ promotion answers the question: where does their audience and traffic come from. Organic growth looks like a smooth curve; paid growth looks like sharp subscriber spikes.
What to look at:
- Paid social ads. Assess which offers and creatives competitors are running, and to what audience.
- Seeding in niche communities. Look for identical posts appearing across different communities — a sign of seeding.
- Work with bloggers. Look for tags, partner posts, and similar mentions across influencers.
- Subscriber dynamics. A sharp jump with no viral content = paid promotion.
This helps you gauge not just ideas but also the competitor’s budget scale: if they’re running dozens of seeded posts every month, you won’t outpace them organically — you need your own channel mix.
Analyzing competitors’ social media ads: where to find creatives
Analyzing competitors’ social media ads means reviewing their paid ads: offers, visuals, landing pages, and calls to action. Even without access to their ad accounts, you can learn a lot.
Where to find creatives:
- Official platform ad libraries — show brands’ active ads.
- Services like publer.pro — also collect dark posts (ones not shown in the regular feed).
- Retargeting — follow a competitor and interact with their site, and their ads will start following you.
- Blogger tags — partner integrations marked as “ad.”
Note down recurring offers: whatever a competitor keeps running for months is almost certainly profitable. That’s a ready-made cue for your own hypotheses.
Analyzing competitors’ communication and tone
This block is often skipped, and that’s a mistake — it’s where quick wins are often hiding. Communication tone is the style a brand uses to engage its audience: formal or friendly, expert-driven or emotional, and how it handles questions and negativity.
Analyzing competitors’ communication without access to their private messages relies on open data:
- Comments under posts — how they respond, how fast, in what tone.
- Reviews and discussions — how they react to negativity.
- Response speed — ask a question under a post from a test account and measure the response time.
- Direct messages — write in as a regular customer and evaluate the greeting, speed, and presence of a chatbot.
Analyzing communication tone
Turn your observations into a simple scale: tone (formal / neutral / friendly), speed (minutes / hours / days), handling of negativity (ignored / templated / individualized). If a competitor takes days to respond to objections with canned replies, your fast, genuine communication becomes a competitive advantage without spending a single dollar on ads.
Tools for analyzing competitors’ content and social media
The right toolkit depends on the platforms and your budget. Below is a comparison table of tools for competitor analysis you can use as a reference. Prices are approximate and change over time, so check current rates.
| Tool | What it does | Platforms | Price (approx.) |
|---|---|---|---|
| Popsters | Post analysis, ER, best posting times, exports | Most social platforms | Free trial, then from ~$5/month |
| JagaJam | Benchmarks, brand rankings, in-depth SMM analytics | Major social platforms | Paid, enterprise-level plans |
| Lucmus | Community monitoring, content statistics | VK and others | Free tier + paid plans |
| SimilarWeb | Website traffic, sources, audience geo | Web analytics | Free limited tier + paid |
| TargetHunter | Audience parsing, finding active followers | VK | From ~$9/month |
| publer.pro | Finding ad creatives, including dark posts | Social platforms and ads | Free tier + paid |
The logic for choosing tools for competitor analysis is simple: use Popsters or JagaJam for content and ER analysis, publer.pro and ad libraries for ads, TargetHunter for parsing VK audiences, and SimilarWeb for evaluating website traffic. You can start for free with a manual spreadsheet and platforms’ built-in statistics — that’s enough for monitoring competitors on social media at the outset.
How to present your analysis: a report template
Monitoring competitors on social media is pointless if the data just sits there. Structure it into a single table — that’s your report for comparative competitor analysis.
A table template for recording competitor data:
| Parameter | Competitor A | Competitor B | Competitor C | Us |
|---|---|---|---|---|
| Platforms and followers | ||||
| Posting frequency | ||||
| Top formats (A+) | ||||
| Average ERpost | ||||
| Promotion (ads/seeding) | ||||
| Active ad offers | ||||
| Tone and response speed | ||||
| Strengths | ||||
| Weaknesses / gaps |
It’s useful to layer a SWOT analysis on top of the table for each competitor and build a positioning map — showing where you and your rivals sit along two key axes (for example, “price vs. expertise”). This turns numbers into strategic conclusions.
Turning insights into a content plan and ad strategy
This is the key stage most people skip. Analysis for its own sake is useless — the point is to turn competitors’ content strategy into your own actions.
Algorithm for turning insights into decisions:
- A+ formats → content plan categories. Take competitors’ working formats and adapt them to your own tone of voice, rather than copying verbatim.
- Competitor gaps → your topics. If no one covers implementation, support, or case studies, claim that space.
- Ad offers → creative tests. Recurring competitor ad offers are ready-made hypotheses for your own ads.
- Weak competitor communication → your USP. Fast, genuine responses if competitors struggle here.
- ER benchmarks → targets. Set engagement goals based on niche averages, not guesswork.
Prioritize hypotheses by “impact vs. effort”: implement the quick wins with low cost first. That’s how competitor promotion analysis and post breakdowns turn into a concrete plan for the month.
Common mistakes in competitor content analysis
- Looking only at top posts. Outliers distort the picture — analyze the full dataset and the median.
- Confusing content metrics with business metrics. ER and likes don’t equal revenue.
- Copying blindly. Someone else’s format might not fit your audience or positioning.
- Analyzing too many competitors. 3–5 direct ones are enough; the rest is noise.
- Doing a one-off analysis. Social media changes fast, so regular monitoring of competitors is needed.
- Ignoring communication. Tone and response speed are often the most underrated source of advantage.
- Not turning findings into action. A report without a content plan is wasted time.
In short: a checklist for analyzing competitors’ social media
- Build a list of 3–5 direct competitors and 2–3 indirect ones.
- Go through each one across three blocks: content, promotion, communication.
- Collect posts and score them using the Grades system, accounting for outliers.
- Calculate ERpost and ERday, and gather niche benchmarks.
- Review ads and offers via ad libraries and publer.pro.
- Check tone and response speed using a test account.
- Combine everything into a comparison table and build a positioning map.
- Turn insights into a content plan and ad hypotheses.
- Repeat the cycle quarterly, with light monthly monitoring.
Analyzing competitors’ content isn’t a one-time exercise — it’s an ongoing process. Done regularly, honestly (without kidding yourself that “we’re better”), and tied to the sales funnel, it gives you the most valuable thing of all: the ability to grow from someone else’s experience while saving your own budget on testing.
FAQ
- How often should you analyze competitors' social media content?
- Run a full analysis quarterly, and do light competitor monitoring monthly. When launching a new product or ad campaign, run a targeted post analysis more often so you don't miss shifts in formats and offers. Consistency matters more than depth: a short monthly trend snapshot is more valuable than one big annual report.
- Which matters more — likes and comments, or reach and sales?
- Likes and comments show engagement, but they aren't business metrics. For content strategy, look at ER (engagement rate) and reaction structure; for effectiveness, look at reach, clicks, and leads. You can't see another account's sales, so rely on indirect signals: pinned posts, links in posts, the frequency of sales-focused content, and recurring offers.
- What free tools can you use to analyze competitors' social media?
- A basic free toolkit for competitor analysis includes manual data collection in a spreadsheet, platforms' built-in statistics, free tiers of Popsters and publer.pro, and SimilarWeb for estimating website traffic. Social media ad libraries let you view active creatives for free. For systematic SMM competitor analysis, paid plans from JagaJam or Popsters are more convenient.
- How many competitors is enough to analyze for an SMM strategy?
- Ideally 3–5 direct competitors plus 2–3 indirect or substitute ones. Fewer, and you won't spot patterns; more, and you'll drown in data. For comparative competitor analysis, choose those closest to you in niche, audience, and budget, and add one ambitious market leader as a benchmark reference.
- How do you track hidden (dark) competitor ads on social media?
- Dark posts don't appear in the feed, but they show up in platforms' ad libraries and services like publer.pro. Also look for 'ad' and 'partner post' labels from bloggers, track subscriber spikes with no organic cause, and follow a competitor from several accounts so retargeting starts showing you their creatives.
- How do you assess a competitor's communication tone without access to their private messages?
- Analyze open channels: comments, replies under posts, reviews, and discussions. Assess response speed, style (formal or friendly), and how negativity and objections are handled. Ask a question under a post from a test account and measure response time — this gives an objective picture for competitor communication analysis.