TAM SAM SOM: How to Calculate Market Size


TL;DR
TAM SAM SOM are three levels of market sizing: TAM (total potential demand), SAM (the segment you can actually serve) and SOM (the share you'll capture in 1-3 years). Both are calculated with top-down and bottom-up methods. This article covers formulas, a full numeric example in rubles, a comparison table, a calculation template, the PAM extension, and a list of common mistakes.
Before investing money in a product, hiring a team, or approaching investors, you need to answer a simple question: how much money actually exists in this market? The TAM SAM SOM model answers this at three levels of detail — from total theoretical demand down to the share you’ll actually capture in the first years. This is a foundational market-sizing tool, and no sound business plan or investor pitch deck goes without it.
In this article we’ll cover plain-language definitions, formulas, top-down and bottom-up approaches, a full numeric example of calculating TAM SAM SOM in rubles, a comparison table, a template you can use for your own calculation, the PAM extension, and a list of common mistakes. This material is equally useful for an IT startup founder and for a marketing director in services or B2B.
What TAM, SAM and SOM Mean in Plain Terms
Market size is best visualized as three nested circles: large, medium, and small. Each subsequent circle is a more honest narrowing of the previous one.
- TAM (Total Addressable Market) — total market size, i.e., all potential demand for your product category if literally every possible customer bought it. This is the upper bound, the industry’s revenue “ceiling.”
- SAM (Serviceable Addressable Market) — the serviceable market segment: the part of TAM you can realistically reach given your product, geography, language, regulations, and sales model. This is the market you can theoretically compete for.
- SOM (Serviceable Obtainable Market) — the realistically achievable market share: the part of SAM you’ll capture in the next 1-3 years, accounting for competition, budget, channels, and growth speed. This is a forecast, not a wish.
Simple analogy. Imagine you’re opening a coffee shop. TAM is everyone in the country who drinks coffee. SAM is the residents of your city who can conveniently reach you. SOM is those who will actually become your customers in the first year, while dozens of other coffee shops operate nearby. The first number is impressive, the second sets the frame, the third is what you’ll actually live on.
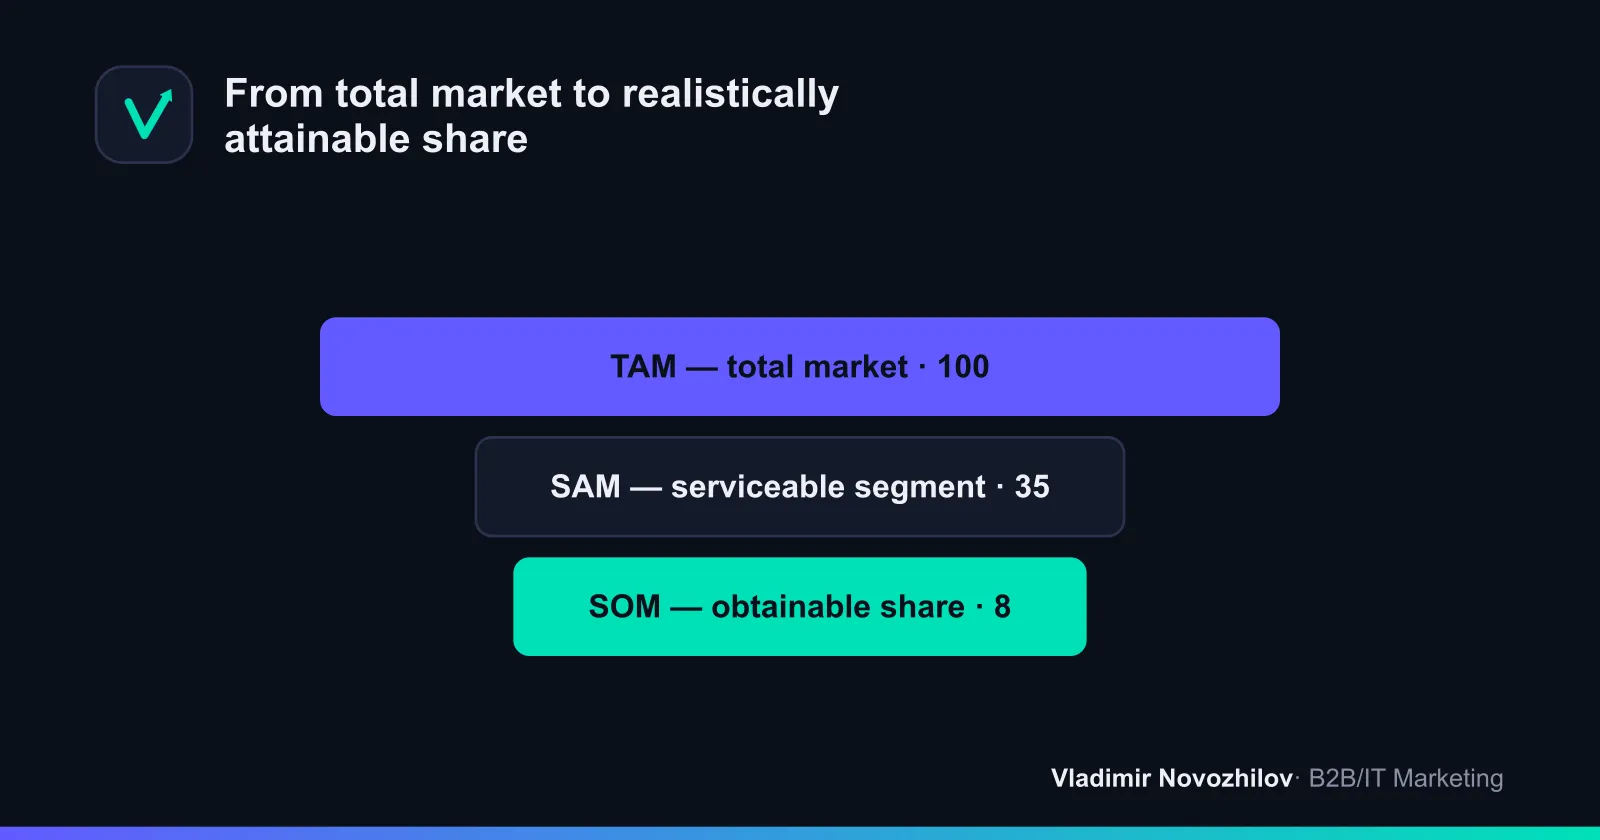
It’s important to note right away: TAM is not your future revenue. It’s the size of the whole pie. Your job is to honestly show which slice you can actually cut off. That’s why experienced investors care less about an impressive total addressable market and more about the logic behind narrowing it down to SAM and SOM.
Why Calculate Market Size: TAM, SAM, SOM in a Business Plan and Investor Pitch
Calculating TAM SAM SOM solves several practical tasks, and all of them are about data-driven decisions rather than gut feeling.
1. Validating commercial viability. If the entire market is, say, 200 million rubles a year, but you want to build a billion-ruble revenue company, the math doesn’t add up. Market sizing at an early stage saves years of work in a niche that’s fundamentally too small.
2. An argument for investors. In a pitch deck, the market-size slide is mandatory. Investors want to understand market potential and whether the business can grow tenfold or more. At the same time, an inflated TAM works against you: the moment the number looks unrealistic, trust in the entire presentation drops.
3. Segment prioritization and go-to-market strategy. By breaking the market into segments and calculating SAM for each, you can see where demand is denser and where it’s most efficient to direct your early efforts. This directly shapes your target audience definition and go-to-market strategy.
4. Setting goals and benchmarking. SOM turns into a concrete sales plan, and comparing your market share to SAM shows how much room for growth remains.
5. Connection to unit economics. Market size is meaningless in isolation from the economics of a single deal. If average deal value is low and acquisition cost is high, even a large market won’t guarantee profit. That’s why market sizing and unit economics always go hand in hand: TAM sets the scale, while ACV (Annual Contract Value) and margin set the realism.
TAM vs SAM vs SOM: Side-by-Side Comparison (Table)
To keep the differences straight, it helps to compare the three metrics across key criteria: scale, realism, formula, and practical use.
| Criterion | TAM | SAM | SOM |
|---|---|---|---|
| What it means | Total Addressable Market — all demand for the category | Serviceable Addressable Market — the serviceable segment | Serviceable Obtainable Market — the obtainable share |
| Scale | Maximum, industry “ceiling” | Medium, limited by your capabilities | Minimum, realistic over 1-3 years |
| Realism | Theoretical figure | Conditionally achievable with full coverage | Practical revenue forecast |
| Constraints | Ignores competition and resources | Geography, language, product, regulation | Competition, budget, channels, speed |
| Base formula | Total number of customers × average deal value | TAM × share of the relevant segment | SAM × realistic market share (%) |
| Time horizon | Long-term / theoretical | Medium-term | 1-3 years |
| Purpose | Show the scale of opportunity | Define the target market | Set a sales plan |
This table addresses the main question people search for — “what’s the difference between TAM, SAM and SOM.” Next, let’s move to the most important part: how to calculate market size in practice.
How to Calculate TAM: Top-Down, Bottom-Up, and Value Theory Approaches
Three methods are used to calculate total addressable market. Best practice is to calculate with at least two and cross-check the results.
Top-Down Approach
The top-down approach works “from the top down”: you take a ready-made estimate of a large market from an industry report and progressively narrow it using percentages. For example: the global market for X is $50 billion, Russia accounts for 2%, and your segment is 15% of that. Multiply everything together to get TAM.
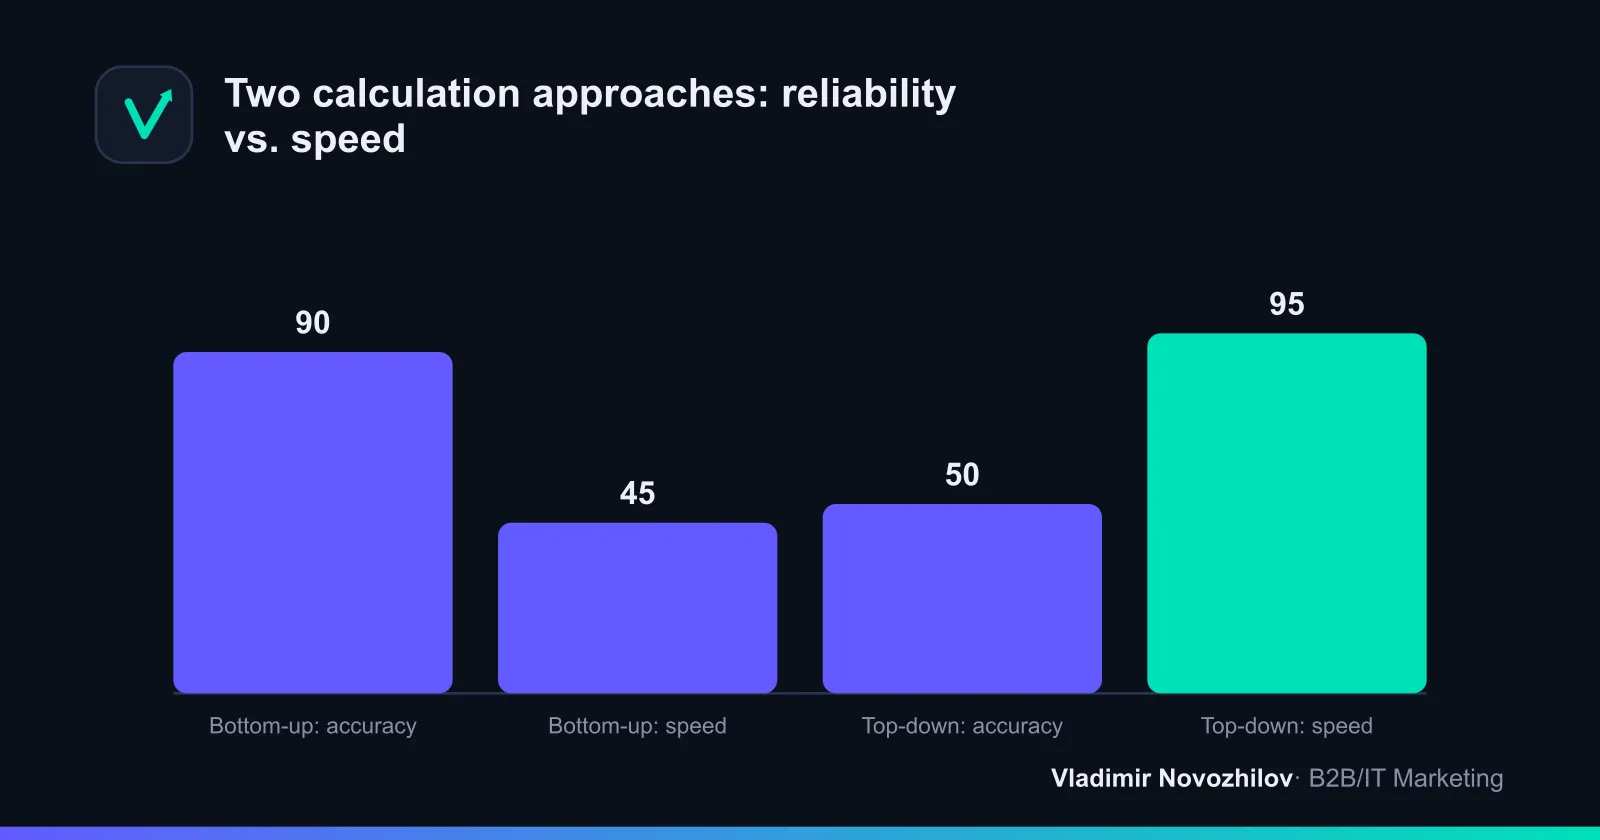
Pros: fast, good for a first estimate. Cons: heavily dependent on someone else’s estimates and often overstates the result, because borrowed percentages rarely map precisely onto your niche.
Bottom-Up Approach
The bottom-up approach works “from the bottom up”: you count the number of potential customers and multiply by the average annual contract value.
TAM = number of potential customers × average annual contract value (ACV)
For example: there are 320,000 small businesses in the country that need your service, and the average contract is 30,000 rubles a year. TAM = 320,000 × 30,000 = 9.6 billion rubles. This method is more accurate because it relies on real customer and pricing data, and it’s the one investors tend to prefer.
Value Theory Approach
The value theory approach is used when a product is new and has no direct analogs. The logic: estimate how much value the product creates for the customer and what portion of that value they’re willing to pay you, then multiply by audience size. The method is subjective, but it’s indispensable for innovative products that don’t yet have an established market.
Which Approach to Choose
The optimal path is to combine them. Make a quick top-down estimate, then validate it with a bottom-up calculation. If the numbers differ by multiples, there’s likely an error in your assumptions somewhere. When two independent methods converge, that’s the best sign your market-size estimate is reliable.
Step-by-Step SAM Calculation: Narrowing the Market to a Realistic Segment
SAM (serviceable addressable market) is the part of TAM you can realistically serve right now. To get there, progressively cut away everything you can’t reach.
- Geography. Remove regions and countries where you don’t operate. If you only sell in Russia, cut out the rest of the world.
- Customer segment. Keep only those who fit your product — for example, companies of a certain size or industry.
- Product fit. Exclude customers who need functionality you don’t have.
- Sales model and price. Remove those for whom your price tier is unaffordable or, conversely, too cheap.
- Regulatory constraints. Account for licenses, certifications, and legal barriers.
SAM = TAM × share of customers matching your geography, segment, and product
For example, out of a 9.6 billion ruble TAM, your product only fits service-sector companies in large cities — say, 35% of the market. Then SAM = 9.6 billion × 35% = 3.36 billion rubles. This is the serviceable market you’ll actually compete for.
How to Calculate SOM: The Market Share You Can Realistically Capture
SOM (serviceable obtainable market) is the most honest and, for planning purposes, the most important number. It answers: how much of SAM will you actually capture in 1-3 years?
There are two ways to calculate it.
Method 1: Via realistic market penetration rate. Estimate what share of the serviceable market you can capture given competition and resources.
SOM = SAM × realistic market share (%)
If there are several strong players in the market, a newcomer can realistically expect 1-5% of SAM in the first year. Example: SOM = 3.36 billion × 4% = 134 million rubles.
Method 2: From the bottom, via the sales funnel. Calculate how many leads you can generate with your marketing budget, your conversion rate to a closed deal, and average deal value. Multiply these together and you get an actually achievable revenue figure. This method is more accurate because it’s based on your real channels and capacity.
Best practice, once again, is to cross-check: the top-down market share and the bottom-up funnel calculation should roughly match. If the funnel gives you 30 million but the market-share method gives 300 million, the share is overstated and sales won’t be able to deliver it.
Full Worked Example: Calculating TAM, SAM, and SOM for a Real Case
Let’s walk through a complete example using a relatable case: a bookkeeping and inventory automation service for small businesses in Russia.
Step 1. TAM (bottom-up). According to registries, there are about 5.6 million small and medium-sized businesses in Russia. Suppose the service is potentially needed by 40% of them — that’s 2.24 million companies. Average annual contract value (ACV) is 12,000 rubles.
TAM = 2,240,000 × 12,000 = 26.9 billion rubles per year
Step 2. Top-down validation. Industry reports estimate the business-automation software market in the country at, say, 180 billion rubles, of which the bookkeeping segment for micro and small businesses accounts for about 15% — roughly 27 billion rubles. The two methods align, so the TAM estimate is reasonable.
Step 3. SAM. Your product is tailored for trade and services, works only with Russian accounting systems, and is designed for companies below a certain revenue threshold. That fits 31% of the market.
SAM = 26.9 billion × 31% = 8.34 billion rubles
Step 4. SOM. The market has 3-4 major competitors. A realistic market share for you in the first 12-18 months is about 5%.
SOM = 8.34 billion × 5% = 417 million rubles
Step 5. Validating SOM via the funnel. Your marketing budget can generate 60,000 leads a year, conversion to paying customer is 5%, meaning 3,000 customers × 12,000 rubles = 36 million rubles in the first year. The gap shows that a 5% share isn’t achievable immediately, but rather by the end of a 2-3 year horizon. For year one, it’s more honest to budget 40-50 million rubles.
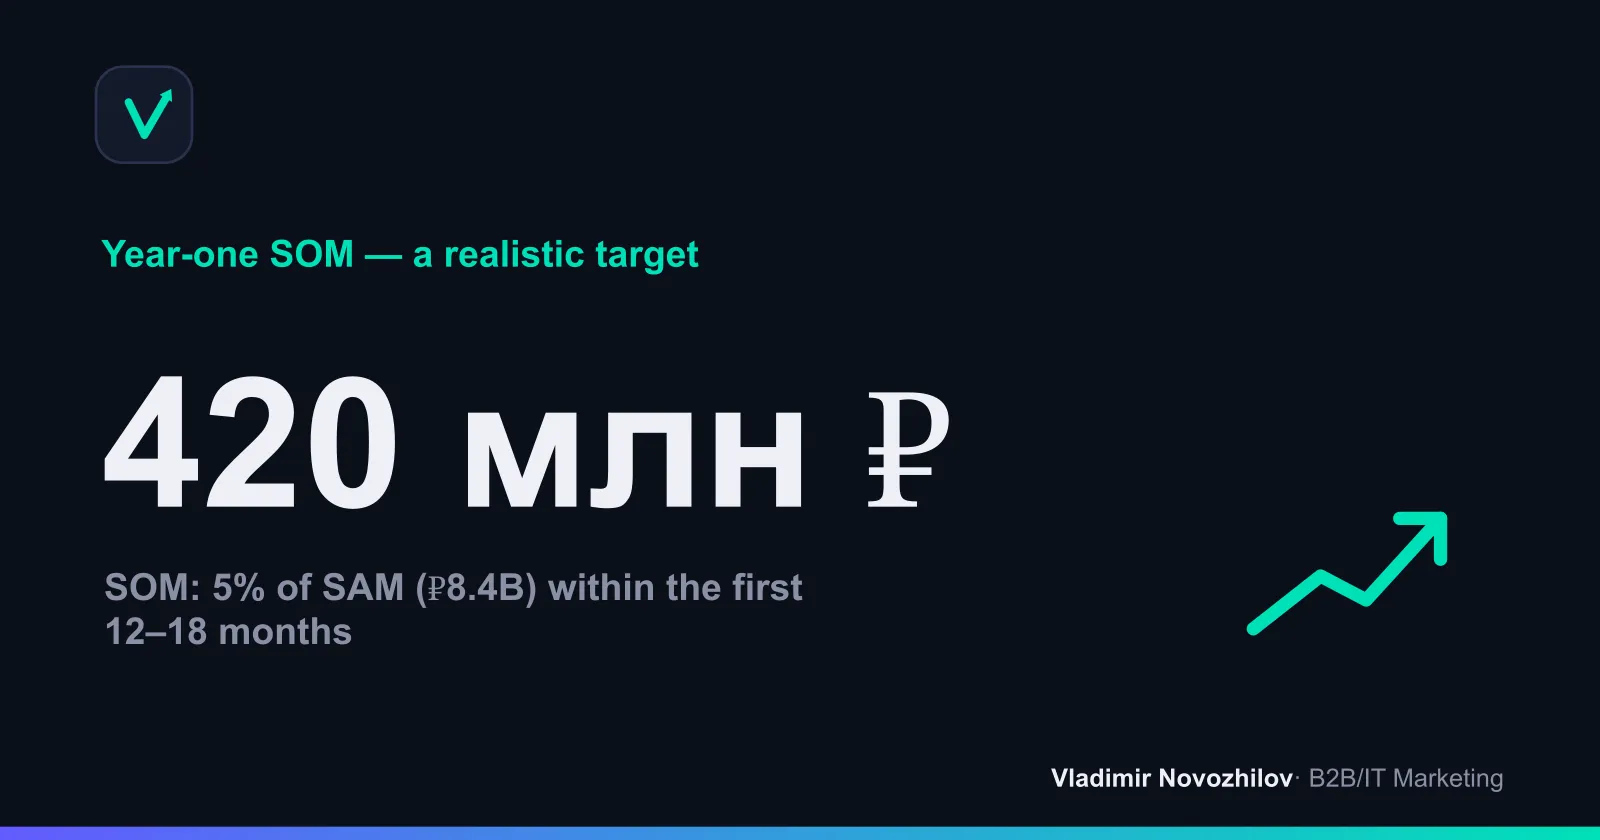
This example illustrates the key rule: TAM impresses, SAM focuses, and SOM keeps you grounded. A gap between the “market share” method and the “funnel” method isn’t an error — it’s a signal to clarify your planning horizon.
A Template for Your Own Calculation
Copy this table and plug in your own numbers to get a ready-made mini market-size calculator.
| Metric | Formula | Your Data |
|---|---|---|
| Number of potential customers | from registries/statistics | ___ |
| Average annual contract value (ACV) | from your model | ___ ₽ |
| TAM | customers × ACV | ___ ₽ |
| Share of relevant segment | % by geography/product | ___ % |
| SAM | TAM × segment share | ___ ₽ |
| Realistic market share | 1-10% for a newcomer | ___ % |
| SOM | SAM × market share | ___ ₽ |
| Funnel validation | leads × conversion × deal value | ___ ₽ |
Where to Get Data: Sources and Tools for Market Sizing
The quality of your TAM SAM SOM calculation depends entirely on the input data. Here are proven sources.
- Industry reports from analytics firms. Gartner, IDC, Statista, and local research firms provide market-size estimates by category. Useful for top-down estimates, but check the methodology and data year.
- Government statistics and registries. Data from statistics agencies, tax authorities, and industry associations form the foundation for bottom-up counts: number of companies, revenue, businesses by industry code.
- Competitors’ financial statements. Revenue figures from public players and estimates of their market share help reconstruct market size by working backward.
- Your own data and pilots. Conversion rates, average deal value, and sales cycle from your own sales activity are the most reliable source for SOM.
- Expert interviews. Conversations with industry insiders let you correct assumptions that don’t appear in any report.
- Analytics tools. Prospecting tools and B2B databases give you company counts by segment, which is handy for bottom-up market sizing.
The rule is simple: use at least two independent sources for any given number. When the estimates converge, confidence in the calculation grows.
PAM, TAM, SAM, SOM: An Extended Market-Sizing Model
The classic trio is increasingly complemented by a fourth, higher-level layer — PAM. The full model is often written as PAM TAM SAM SOM.
PAM (Potential Addressable Market) is the potential market size — the entire conceivable demand accounting for future growth, new segments, and geographies you could theoretically expand into. If TAM answers “how much market exists today,” PAM answers “how big will it become, and where could we expand tomorrow.”
The nesting logic looks like this:
- PAM — the entire potential market, including adjacent segments and future directions.
- TAM — the market addressable by your product category right now.
- SAM — the segment you can serve with your current model.
- SOM — the share you’ll realistically capture in the coming years.
Why it matters. PAM is useful for strategy and for conversations with investors about the long-term picture: it shows the business won’t hit a ceiling after capturing its first market. For example, an accounting service for small businesses in Russia has its own TAM, but its PAM includes expansion into neighboring countries and launching products for mid-sized businesses. The key is not to substitute PAM’s figure for TAM: you can’t blend current and potential market into a single number.
Common Mistakes When Calculating TAM SAM SOM — and How to Avoid Them
Most failed market-sizing exercises repeat the same handful of mistakes. Here’s a checklist of what to avoid.
- Confusing TAM with potential revenue. TAM is the entire market, not your money. Your revenue is closer to SOM. The claim “our TAM is 50 billion, so we’ll make billions” reads as immaturity to investors.
- Relying only on top-down without bottom-up validation. Estimates based on someone else’s percentages are almost always inflated. Always validate with a bottom-up calculation.
- Ignoring competition and barriers to entry. If you assume 30% market share in year one while strong incumbents exist, no one will believe the number. Barriers (licenses, customer habits, switching costs) lower your real SOM.
- Using outdated data or mixing time periods. The 2019 market and the 2025 market are different numbers. Don’t mix monthly and annual contract values, or different currencies and report years.
- Inflating TAM to make a slide look impressive. An unrealistic total addressable market undermines trust in the entire presentation. A modest, well-justified number beats an inflated, made-up one.
- Ignoring unit economics. A large market won’t save a business with negative deal margins. Calculate market size together with ACV, acquisition cost, and retention.
- Not specifying geography. Always explicitly state which territory you’re calculating for. “Global market” and “Russian market” are entirely different conversations.
- Forgetting the time horizon. SOM without a stated period (1 year? 3 years?) is meaningless.
Checklist: Using TAM SAM SOM for Growth Strategy
Let’s bring it all together into a practical checklist. Work through these points and you’ll have a solid, defensible market-size estimate.
- Define the category and market boundaries. Pin down exactly what you sell, to whom, and your target audience and geography.
- Calculate TAM using two methods. Do a bottom-up calculation (customers × ACV) and validate it top-down against industry reports. Cross-check.
- Narrow down to SAM. Progressively cut away everything you don’t serve: geography, segment, product, regulation.
- Calculate SOM two ways. Via realistic market share and via the sales funnel. Reconcile the two figures and specify the time horizon.
- Add PAM if you need the long-term picture. Show where the business can expand further down the road.
- Connect it to unit economics. Verify that at your deal value and acquisition cost, SOM actually produces profit.
- Cite your sources. Every number should have a traceable origin — this is what builds investor trust and improves decision accuracy.
- Recalculate regularly. Update the calculation at least once a year and ahead of every major new stage.
Properly calculated TAM, SAM, and SOM figures aren’t a slide for show — they’re a working tool. They point you toward the right go-to-market strategy, help you find product-market fit in the right segment, and keep the team from overestimating its own ambitions. Calculate honestly from the bottom up, cross-check with a second method, and the numbers will work for you instead of against you.
FAQ: Common Questions About Market Sizing
Below are short answers to the questions that come up most often when sizing a market. Detailed answers are provided in the dedicated Q&A block earlier on this page.
FAQ
- What's the difference between TAM, SAM and SOM?
- TAM (total addressable market) is the entire demand for a product category if every possible customer bought it. SAM (serviceable addressable market) is the portion of TAM you can realistically serve given your product, geography, and sales model. SOM (serviceable obtainable market) is the share of SAM you'll realistically capture in 1-3 years, given competition and resources.
- How do I calculate TAM if there are no ready-made industry reports?
- Use a bottom-up approach: take the number of potential customers from public sources (registries, directories, statistics) and multiply by the average annual contract value. This is more reliable than guessing from global figures. You can also apply value theory — estimate how much a customer is willing to pay for the value created and multiply by audience size.
- What TAM size looks good to investors for a startup?
- Venture investors typically want to see a TAM of at least $1 billion (or a comparable figure in rubles for a local fund) so the business can grow into a large company. But the logic matters more than an inflated number: how you arrived at it bottom-up, and how realistic your SAM and SOM are. A well-justified TAM of 300 million is worth more than a fabricated 50 billion.
- Which calculation method is more accurate: top-down or bottom-up?
- The bottom-up approach is usually more accurate and more credible because it's built on real customer and pricing data. The top-down approach is faster and good for a first estimate, but it easily leads to overestimation. Best practice is to calculate with both methods: if the numbers converge, your market-size estimate is reliable.
- Can TAM and SAM be the same number?
- Yes, if your product essentially covers the entire addressable market with no geographic, language, regulatory, or product constraints. In practice this is rare — there's almost always a segment you don't yet serve. If TAM equals SAM, be ready to explain why there's no narrowing.
- How often should market size be recalculated?
- Recalculate TAM SAM SOM at least once a year, and also when entering a new segment or geography, launching a new product, making a significant price change, or ahead of a funding round. Markets and prices shift, so an estimate based on stale data quickly loses strategic value.