Analyzing Competitor Positioning and USPs: Methods and Template


TL;DR
Competitor positioning analysis is a structured way to assess how rivals claim space in customers' minds: their USP, value proposition, promises, and proof. This article covers a step-by-step method, comparison criteria, a positioning map, a ready-made table template, and a way to craft your own differentiator based on the findings.
Competitor positioning analysis is a way to understand what idea rivals use to claim a place in the customer’s mind, and to find open ground for your own differentiation. Most guides on the topic reduce everything to comparing prices and products, but it’s positioning and USP that decide who a buyer chooses when features look similar. Below is a step-by-step method: how to find competitors, which criteria to use to break down their brand, how to build a positioning map, score the strength of their promises, and craft your own unique selling proposition. At the end you’ll find a ready-made table template and checklist.
What competitor positioning and USP analysis means
Positioning is the place a brand aims to occupy in the target audience’s mind relative to alternatives. USP (unique selling proposition) is a specific benefit that only this product delivers and that’s hard to copy. Value proposition is broader: it’s the combination of “for whom — what problem we solve — why we’re better than alternatives.”
Competitor positioning analysis brings together three questions: how a rival wants to be perceived, which promise it puts front and center, and what backs that promise up. Unlike general market competitor analysis, which covers finances, channels, and share, here we work with perception — the scarcest resource in any market.
A simple test: if you can swap a competitor’s name into someone else’s tagline and nothing changes, the market has blurry positioning — and that’s your chance to differentiate.
Why analyze competitors’ positioning and value proposition
Analyzing a competitor’s brand and value proposition isn’t about producing a report — it’s about making specific decisions. It helps you:
- Find an open niche. Once you see which promises are already taken, it’s easier to pick an unclaimed angle of perception.
- Craft your own USP. Differentiation is born from contrast: you build a promise where competitors are weak or silent.
- Justify your pricing strategy. Analyzing competitors’ pricing shows where the market tolerates a premium and where it’s stuck in a discount war.
- Optimize marketing. Knowing what rivals are betting on keeps you from wasting budget copying someone else’s message.
- Reduce risk. You see in advance where strong players are heading and avoid launching a product head-on against a leader.
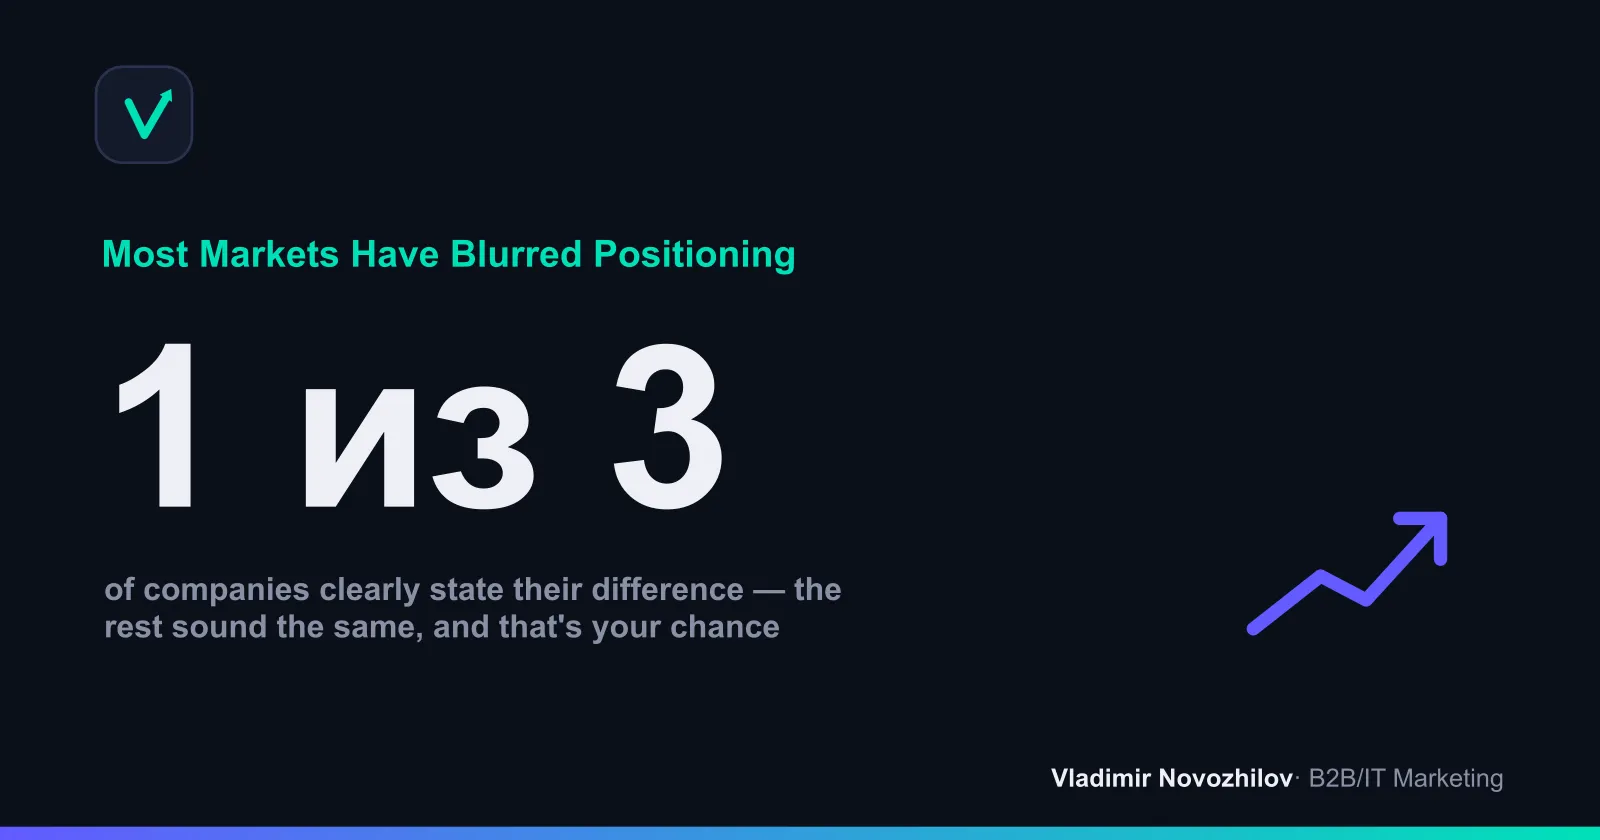
In my experience across B2B and services, only about a third of companies in most markets have a genuinely clear differentiator. The rest sound the same — which means a careful competitor positioning analysis gives you a fast lever for growth.
Types of competitors: direct, indirect, potential, and substitute
Before you dig into USPs, define whose positioning you’re actually analyzing. This typology saves weeks of work.
- Direct competitors — offer the same product to the same audience (two contextual advertising agencies for mid-size businesses).
- Indirect competitors — solve the same problem differently (instead of an agency, a client hires an in-house marketer).
- Potential competitors — not in your market yet, but could enter easily (a large platform adding your feature).
- Substitutes — the customer meets the need in a completely different way (skips promotion services altogether and relies on word of mouth).
For positioning analysis, direct and indirect competitors matter most: they’re the ones the customer compares you against at the moment of choice.
How to find competitors for positioning analysis
The question “how do I find competitors” is best answered through several channels at once. Don’t stop at the first page of search results.
- Search results for your category’s key queries — top paid and organic listings.
- Customer surveys — ask who else they considered before buying. This is the most honest list you’ll get.
- Industry directories, ratings, marketplaces, and niche platforms.
- Analytics tools — SimilarWeb, Serpstat, SpyWords, Keys.so show who ranks and advertises for your queries.
- Social media and press — via hashtags, mentions, and targeting data.
Select 5–7 players for deep analysis: 3–4 direct, 1–2 indirect, and one market leader as a benchmark. The BANT logic can help you qualify how seriously a player actually competes for your budget and audience.
Criteria for analyzing competitors’ USP and positioning
To keep the comparison consistent, fix a single set of criteria. Here’s a working minimum for analyzing competitors’ USP and brand:
- Target audience — who the product clearly targets.
- Core promise (USP) — the main benefit in one phrase.
- Value proposition — the combination of “for whom / problem / difference.”
- Proof — case studies, numbers, guarantees, reviews.
- Brand tone and emotion — expert, friendly, status-driven.
- Price positioning — economy, mid-range, premium.
- Channels and touchpoints — where and how the message is delivered.
- Competitive advantage — what’s genuinely hard to replicate.
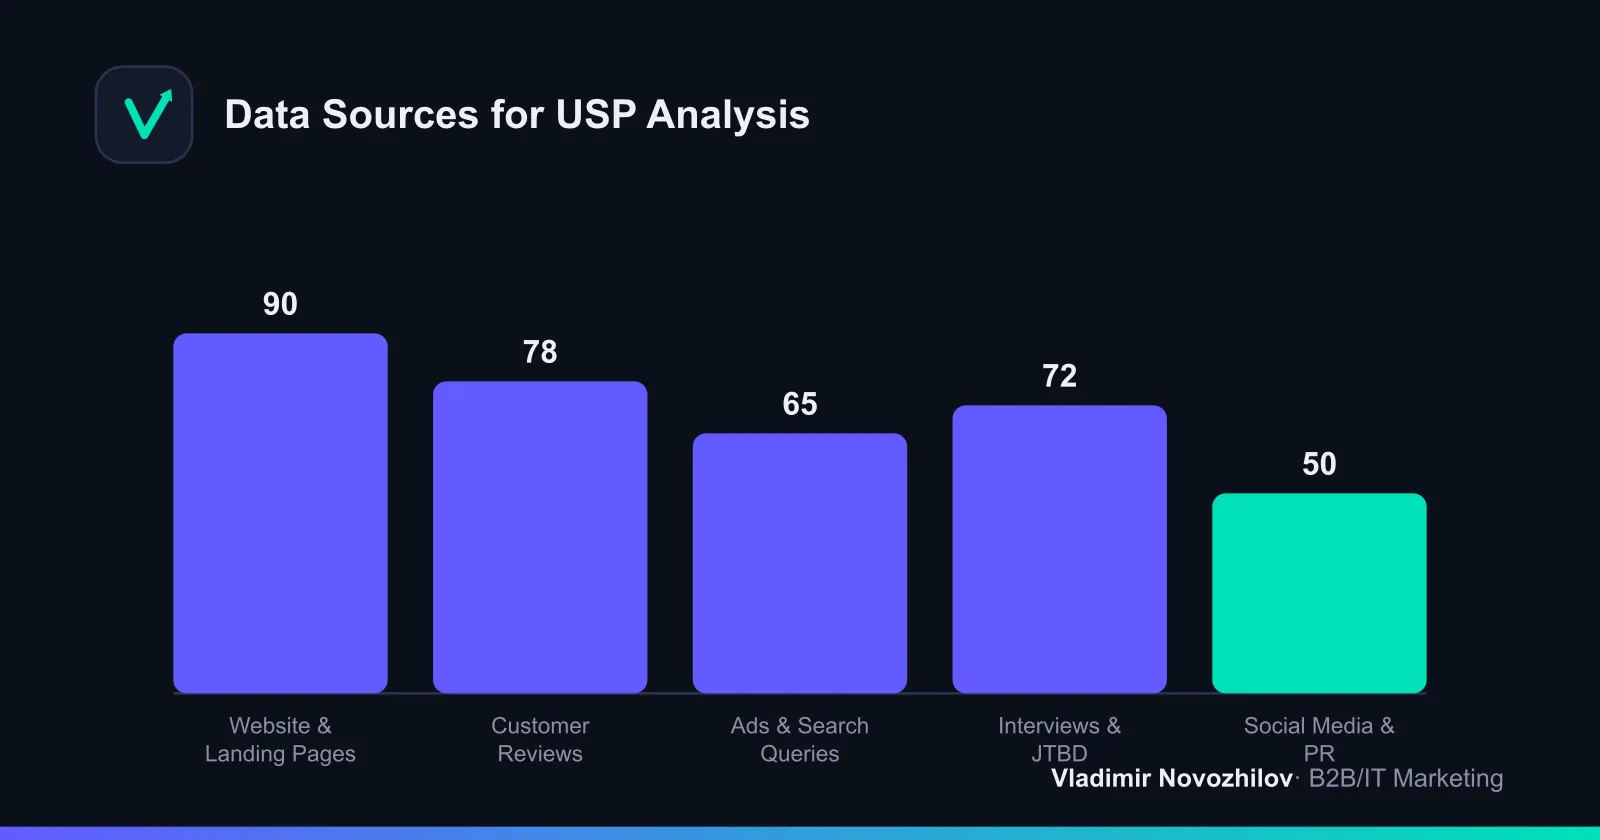
Data for these criteria comes from open sources: websites and landing pages reveal the stated promise, reviews and interviews reveal real value as customers see it, and ads and search queries reveal where the bet is placed. Comparing the stated promise with the perceived value is the most valuable part of the analysis.
How to analyze a competitor’s brand: a step-by-step guide
It’s best to run competitor brand analysis along the same route for every player so the data stays comparable.
Step 1. Fix the goal
Decide what decision you’ll make based on the results: change your USP, enter a new segment, rebuild pricing. The goal drives the depth of analysis.
Step 2. Collect the “as-is” promises
Write down, word for word, the headlines on main pages, taglines, and landing page hero sections. This is exactly what the competitor considers its main argument.
Step 3. Break down the evidence
Assess what backs up the promise: numbers, case studies, guarantees, social proof. An empty USP with no proof is a competitor’s vulnerability.
Step 4. Check against perception
Read reviews and discussions. Customers often praise a competitor for something completely different from what’s in the USP — that’s a clue for your own niche.
Step 5. Assess pricing policy
Analyzing competitors’ pricing shows how price and promise line up: a premium price without a premium message is a weak spot.
Step 6. Consolidate into a table and draw conclusions
Bring all the data into a single comparison format (template below), then look for patterns and unclaimed angles.
Competitor positioning map: how to build and use it
A positioning map is a two-dimensional chart where the axes represent the two criteria that matter most to the customer, with each player plotted as a point. It visually reveals clusters of competitors and open white space.
Step-by-step build:
- Choose two axes. Pick the criteria with the strongest influence on choice — for example, “price” (low → high) and “level of personalization” (standard → tailored).
- Score each player on both axes on a 1–10 scale.
- Plot the points on the map, including your own brand.
- Find the gaps. Zones with no competitors are potential positioning niches.
- Verify demand. An open zone only matters if there’s an audience and money there.
If you have more than two important criteria, build several maps with different axis pairs. That way you’re not limited by two dimensions and can more precisely locate the space for your own differentiation.
Methods of analysis: SWOT, Porter’s Five Forces, comparative analysis, JTBD
Competitor analysis methods aren’t interchangeable — each covers a different angle. Combine them based on the task.
SWOT analysis of competitors
SWOT analysis breaks each player into strengths, weaknesses, opportunities, and threats. For positioning, the most important link is “competitor weaknesses + unmet customer needs” — that’s where your differentiator is born.
Porter’s Five Forces analysis
Porter’s Five Forces assesses market pressure: supplier and buyer power, threat of new entrants and substitutes, and rivalry intensity. It shows how realistic it actually is to sustain premium positioning in your niche.
Comparative analysis and benchmarking
Comparative competitor analysis lines up all players in one table against uniform criteria. Benchmarking goes further — you take the best practice example (say, how the leader presents its proof) and raise your own bar to match it.
Jobs to Be Done
Jobs to Be Done treats the product as a tool “hired” to do a job for the customer. This method surfaces the real value: customers don’t “hire” a product for its features but for the outcome. Combining JTBD with a positioning map produces the strongest possible USP.
Method comparison
| Method | What it shows | When to use it | Limitation |
|---|---|---|---|
| SWOT analysis | A player’s strengths/weaknesses | Finding a rival’s vulnerabilities | Subjective scoring |
| Porter’s Five Forces | Market pressure and attractiveness | Assessing a niche before entry | No tactical guidance |
| Comparative analysis | All players’ positions side by side | Consolidating data and conclusions | Limited to measurable items |
| Positioning map | Open zones of perception | Finding a niche to differentiate | Only two axes at a time |
| Jobs to Be Done | The product’s true value | Crafting the USP | Requires interviews |
Analyzing the value proposition through reviews and customer interviews
The stated USP and the perceived value often diverge. To see competitors’ value proposition through the market’s eyes, go straight to the source — the customers.
- Reviews and discussions. Note recurring words: what gets praised, what gets complained about. Frequent complaints about a competitor are a ready-made draft of your own promise.
- JTBD-style interviews. Ask: what job were you trying to get done, what did you consider, why did you pick this particular provider, what was missing. The answers reveal the real decision criteria.
- Support and sales questions. Recurring customer questions show where the market’s promises are unclear — that’s your zone of clarity.
Collect customer quotes in a separate column next to the competitor’s stated USP. The gap between what’s promised and what’s valued is the richest source of differentiation.
Quantifying positioning strength
To move past “I like it / I don’t like it” debates, put numbers on positioning. Assign each criterion a weight and a score, and you get a comparable strength index.
The formula is simple: Index = Σ (criterion score × criterion weight), where scores run 1–10 and weights sum to 1.
| Criterion | Weight | Competitor A (score) | Our brand (score) |
|---|---|---|---|
| USP clarity | 0.30 | 9 | 6 |
| Proof | 0.25 | 8 | 5 |
| Differentiation | 0.25 | 7 | 6 |
| Price fit | 0.20 | 6 | 7 |
| Total index | 1.00 | 7.6 | 5.9 |
Run this for every player and you’ll get an objective picture of who’s strong and exactly where you’re falling short. It’s essentially a static “calculator”: change the scores in the table and immediately see the gap.
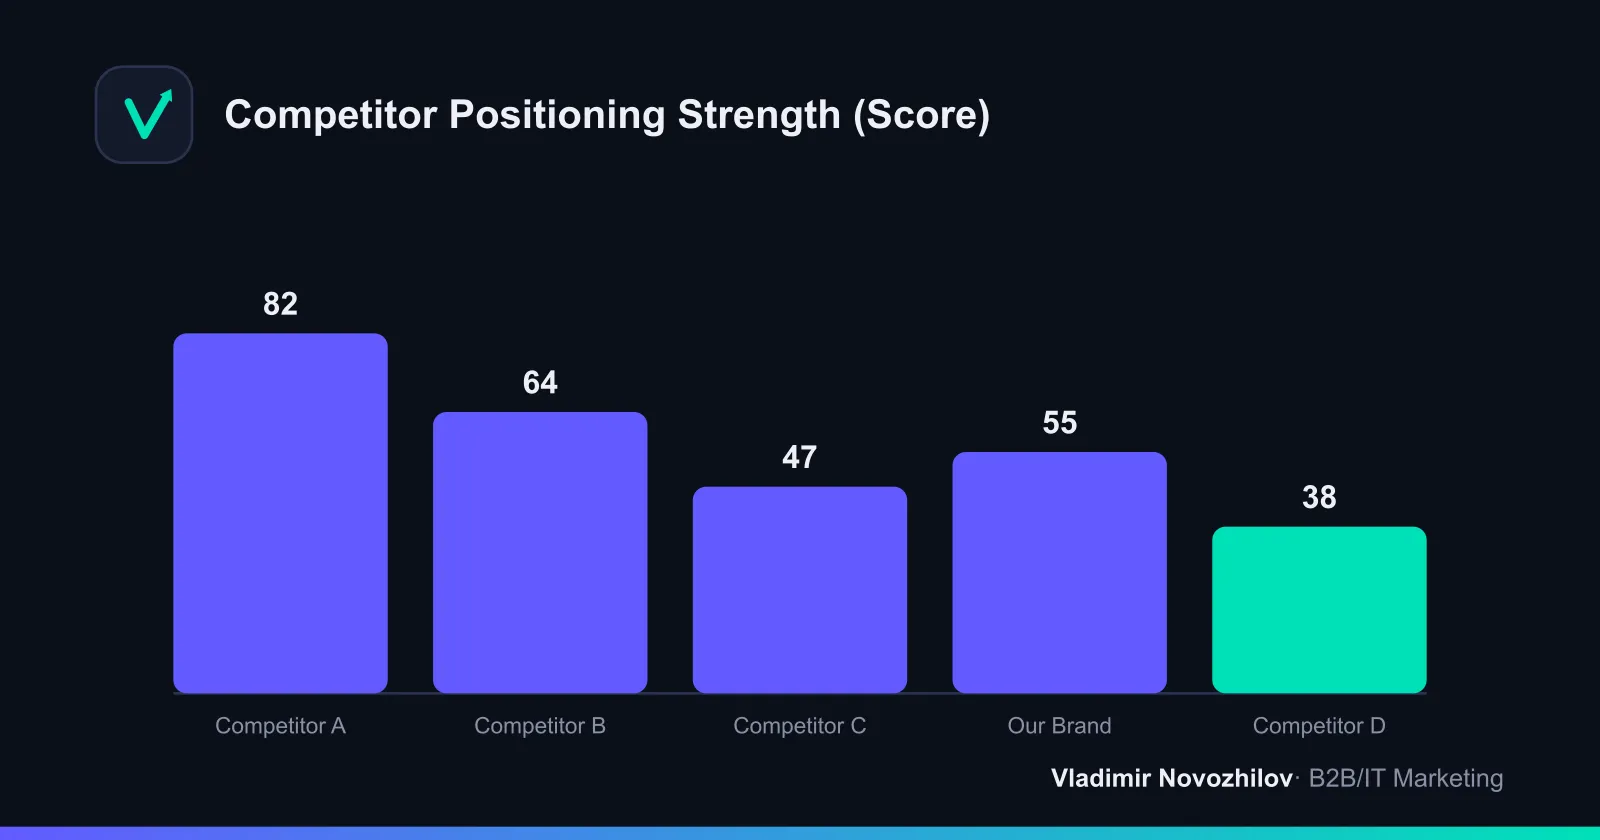
Comparison table of competitors’ USP and positioning
Here’s a working example summarizing three hypothetical players in a services niche. This kind of format is the core of the whole analysis.
| Parameter | Competitor A | Competitor B | Competitor C |
|---|---|---|---|
| Audience | Mid-size business | Small business | Large brands |
| USP | ”Results in 30 days or your money back" | "20% cheaper than the market" | "A team that guides you personally” |
| Value proposition | Speed + guarantee | Savings | Personal approach |
| Proof | Case studies with numbers | Published pricing | Named clients |
| Price positioning | Mid-range+ | Economy | Premium |
| Weak spot | Few reviews | No quality guarantees | Slow onboarding |
The open zones are immediately visible: for example, “premium results with a guarantee and a fast start” is unclaimed — a ready-made basis for your own differentiator.
Case example: how USPs read across different niches
To get a feel for the logic, let’s look at three familiar types of promises:
- Logistics niche. The USP “Delivered in 24 hours or it’s free” is a speed promise with a built-in guarantee. Its strength is measurability; its vulnerability is dependence on operational failures.
- Budget furniture niche. The positioning “design and functionality at an accessible price” rests on scale and self-assembly. It’s hard for a competitor to copy without the same operating model.
- Coffee shop niche. The differentiator “the third place between home and work” isn’t about coffee — it’s about atmosphere. This is positioning through emotion rather than product.
The takeaway: a strong unique selling proposition is built on a measurable benefit, a hard-to-replicate operating model, or an emotional territory competitors haven’t claimed.
How to craft your own USP based on competitor analysis
Once the data is collected, move to synthesis. Follow this sequence:
- List the unclaimed promises from the positioning map and comparison table.
- Overlay them with customer needs from reviews and JTBD interviews.
- Check feasibility — you can only promise what you can actually deliver.
- Draft it using the template: “We help [audience] achieve [outcome] without [pain/risk], unlike [alternative].”
- Test it. Run 2–3 USP variants in ads or on landing pages and compare response through A/B testing. Competitor analysis gives you hypotheses; testing turns them into a proven differentiator.
The chain “positioning analysis → USP hypothesis → A/B test” is something most standard guides skip — and it’s exactly what separates a nice-sounding statement from one that actually works.
Tools and services for online competitor analysis
For gathering data for market competitor and positioning analysis, these are useful:
- SimilarWeb — competitors’ traffic sources and volumes.
- Serpstat, SpyWords, Keys.so — the search and ad queries players are targeting.
- Social media ad libraries — which messages are running in ads.
- Review aggregators and maps — perceived value.
- CRM or a shared spreadsheet — to store and update findings instead of losing them in chat threads.
Tools provide raw material, but people draw the conclusions: a tool will show what a competitor is advertising, but you’re the one who defines what its positioning actually means.
Common mistakes in competitor positioning analysis
- Comparing only prices and features. You miss the main thing — perception and promise.
- Copying someone else’s USP. Repetition makes you “the second one just like them”; the customer picks the original.
- Looking only at direct competitors. Indirect competitors and substitutes often take away more customers.
- Treating stated claims as reality. Without checking against reviews, you’re analyzing ads, not value.
- Doing the analysis once. Competitor positioning shifts — it needs ongoing monitoring.
- Collecting data without acting on it. Analysis without a conclusion and a test is wasted time.
Template and checklist for competitor USP analysis
Copy this structure into a table and fill it in for each player — it’s a ready-made template for analyzing competitors’ USPs:
Template table columns:
- Competitor name and type (direct / indirect / potential)
- Target audience
- Stated USP (verbatim)
- Value proposition
- Proof behind the promise
- Price positioning
- What’s praised in reviews
- What’s complained about in reviews
- Positioning weak spot
- Positioning strength index (per the formula)
Analysis checklist (check off each item):
- Analysis goal and resulting decision defined
- 5–7 competitors of different types selected
- “As-is” promises collected from sites and ads
- Evidence behind each USP verified
- Reviews studied and 3–5 JTBD interviews conducted
- Competitor pricing policy analyzed
- Positioning map built
- Strength index calculated for each player
- Open perception niches identified
- 2–3 own USP hypotheses drafted
- A/B test of wording planned
Work through the checklist top to bottom, and you’ll come away not with a box-ticking report but a concrete differentiator you can test in the market.
Key takeaways
Analyzing competitors’ positioning and USPs isn’t about spying — it’s about finding open space in the customer’s mind. Gather 5–7 players of different types, break down their promises and proof, check them against perception through reviews and JTBD, build a positioning map, and quantify each player’s strength with an index. Your unique selling proposition emerges from the contrast with competitors’ weaknesses and unmet needs — and an A/B test turns the hypothesis into a proven differentiator. Consistency and honest data matter more here than volume: it’s better to deeply analyze five competitors than to skim twenty.
FAQ
- How is positioning analysis different from regular competitor analysis?
- Standard market competitor analysis covers everything: pricing, channels, product, finances, market share. Competitor positioning analysis focuses on one layer only — how a rival wants to be perceived by customers and what USP and value proposition it uses to deliver that promise. The first answers 'what does the competitor do,' the second answers 'what idea lets it win in the buyer's mind.'
- How often should you analyze competitors' USPs?
- How often should you analyze competitors' USPs?
- A full analysis of competitors' USPs is enough once every 6–12 months. But signal monitoring (a new tagline, new landing pages, price changes, fresh reviews) should be done monthly. In fast-moving niches — advertising, ecommerce, IT services — recheck competitor positioning quarterly, since promises there get rewritten often.
- How many competitors are enough for a solid positioning analysis?
- Five to seven players are enough for a working conclusion: 3–4 direct competitors, 1–2 indirect ones, and one potential entrant or market leader as a benchmark. Fewer than three won't reveal patterns, more than ten dilutes the analysis and slows decisions. Depth matters more than breadth here.
- How do you build a positioning map if there are many criteria?
- A positioning map is always two-dimensional: pick the two axes that most strongly influence customer choice (for example, 'price' and 'level of service'). Assess the remaining criteria separately in a comparison table. If there are more than two important axes, build several maps with different pairs — that's how you find the vacant niche no one has claimed.
- Can you use a competitor's USP with a slightly different wording?
- Copying someone else's unique selling proposition is pointless and risky: you become 'the second one just like them,' and customers pick the original. The point of the analysis is to find an unclaimed promise. Take not the competitor's wording but their weak spot or an unmet audience need, and build your differentiator around that.
- What tools help track changes in competitor positioning?
- For data collection, use SimilarWeb (traffic and sources), Serpstat, SpyWords, and Keys.so (search and ad queries), social media ad libraries, and review aggregators. Website changes are easy to catch with page monitoring and subscribing to competitors' newsletters, and findings can be stored in a CRM or a shared spreadsheet.