CAC and LTV in B2B and SaaS: Formulas, Calculation, Benchmarks


TL;DR
CAC is the full cost of acquiring one paying customer; LTV is the gross profit that customer generates over the entire relationship. In B2B/SaaS, LTV is calculated from gross margin and churn, not from revenue. A healthy LTV:CAC ratio is around 3:1, and CAC payback is up to 12 months for SMB and 18–24 for Enterprise.
The basic “CAC is the cost of acquisition” no longer cuts it if you’re a founder or growth lead in B2B/SaaS. You need correct formulas, an LTV adjustment for gross margin, an understanding of the payback period, and current segment benchmarks. Let’s work through all of it with numerical examples in rubles and dollars.
What CAC and LTV are: definitions and why to measure them
CAC (Customer Acquisition Cost) is the full cost of acquiring one new paying customer: all marketing and sales spend over a period, divided by the number of customers acquired.
LTV (Lifetime Value, also known as CLV) is the total gross profit a customer brings the company over the entire relationship.
Together, these metrics answer the central question of unit economics: are you earning more from a customer than you spend to acquire them, and how quickly do you recover the investment? Without this pair, you can neither assess channel efficiency nor make a decision about scaling the budget.
How to calculate CAC correctly: blended vs paid and what to include
The CAC formula, on its own line:
CAC = (Marketing costs + Sales costs) / Number of new customers in the period
The classic beginner mistake is to count only the ad budget. Your costs should include:
- Marketing and sales payroll (in B2B this is often the largest line item);
- Rep commissions and bonuses;
- The cost of tools: CRM, analytics, email services;
- Content production, design, agencies;
- Ad budgets across all channels.
Blended CAC vs paid CAC
Blended CAC is all acquisition costs divided by all new customers, including those who came organically and by word of mouth. Paid CAC is only paid costs divided by customers from paid channels.
Blended CAC looks nice but is deceptive: organic “dilutes” the real cost and creates an illusion of efficiency. When you’re deciding whether to scale advertising, look at paid CAC — it shows exactly how much the next customer from a paid channel costs. Brian Balfour (ex-VP Growth at HubSpot) covered this in detail in an analysis translated by goPractice.
Numerical example
Over the quarter, you spent: advertising 900,000 ₽, sales and marketing payroll 1,500,000 ₽, tools and content 300,000 ₽. That’s 2,700,000 ₽ total. You closed 18 deals.
CAC = 2,700,000 / 18 = 150,000 ₽ per customer.
If 6 of those 18 customers came organically, while paid costs amounted to 1,200,000 ₽ for 12 customers, then paid CAC = 1,200,000 / 12 = 100,000 ₽. The gap between 150,000 and 100,000 ₽ is exactly what’s easy to miss.
How to calculate LTV: the formula with gross margin and churn
The core mistake in calculating LTV is basing it on revenue. A customer brings the company not revenue, but profit after subtracting the cost of serving them (CoGS): hosting, support, payment fees.
The correct LTV formula for SaaS:
LTV = (ARPA × Gross Margin %) / Churn rate
Breaking down the variables:
- ARPA (Average Revenue Per Account) — average revenue per account over a period (month or year); for B2C, ARPU is more commonly used;
- Gross Margin % — gross margin: the share remaining after subtracting the cost of service;
- Churn rate — churn over the same period as ARPA.
Skipping the Gross Margin multiplier inflates LTV by roughly 20% (per Spike AI’s analysis). This isn’t a cosmetic detail: with that inflation, an LTV:CAC ratio of 2.5:1 can pass itself off as 3:1.
Numerical example
ARPA = 20,000 ₽/mo, gross margin = 80%, monthly churn = 4% (0.04).
LTV = (20,000 × 0.8) / 0.04 = 16,000 / 0.04 = 400,000 ₽.
If you calculated from revenue without margin: 20,000 / 0.04 = 500,000 ₽ — an overstatement of 25%.
At a CAC of 150,000 ₽, the honest ratio is 400,000 / 150,000 = 2.67:1, while the “pretty” one is 3.33:1. That’s precisely why margin is mandatory.
Cohort-based calculation instead of averaging
Averaged churn across the whole base hides the truth: new customers leave more often, while long-tenured ones barely leave at all. It’s more accurate to calculate LTV by cohorts — groups of customers who arrived in the same period — and track their retention over time. This matters especially in B2B, where the difference in segment behavior is enormous.
The LTV:CAC ratio — the 3:1 norm and why it’s not dogma
The LTV:CAC ratio shows how many times the lifetime value of a customer exceeds the cost of acquiring them. The classic benchmark is 3:1.
Interpreting the thresholds:
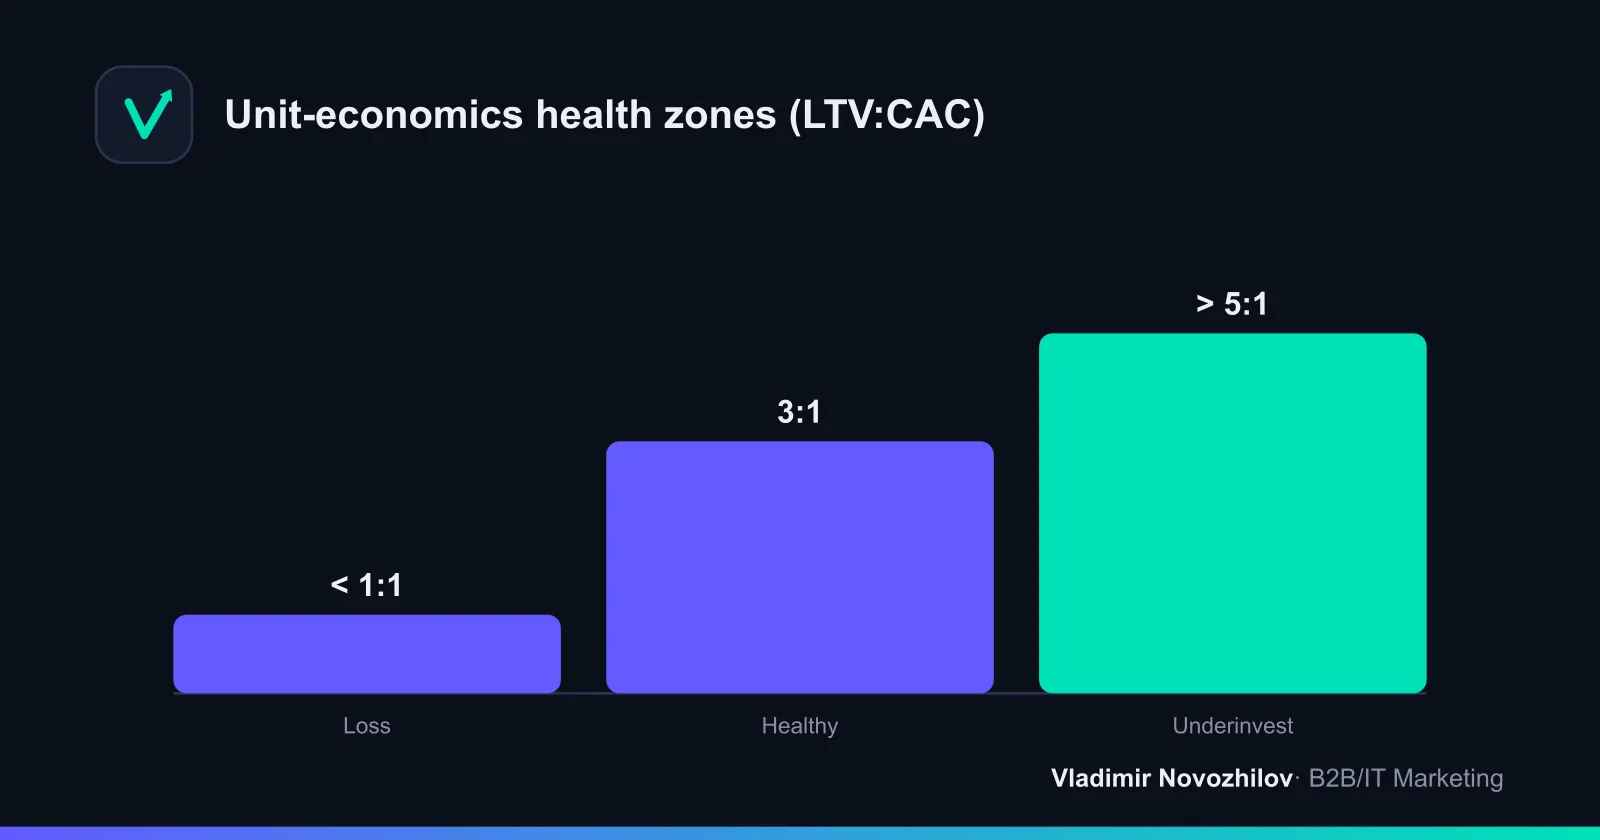
- < 1:1 — you’re losing money on every customer;
- 1:1–3:1 — the risk zone, often failing to cover operating expenses;
- ~3:1 — a healthy balance of growth and profitability;
- > 5:1 — you’re probably underinvesting in growth and leaving market on the table.
An important nuance: the 3:1 rule is an observation, not a law. As Daniil Khanin notes, David Skok (for Entrepreneurs) described 3:1 as an empirical observation of successful SaaS companies, not a mathematically derived constant. The optimal ratio depends on the company’s stage, cost of capital, and growth ambitions. A venture-backed startup can deliberately live with 1.5:1 while aggressively capturing the market; a mature self-funded business might aim for 4:1.
CAC Payback Period: why the payback timeframe matters more than absolute LTV
CAC Payback Period is the number of months in which a customer recovers their acquisition cost through gross profit.
CAC Payback = CAC / (monthly ARPA × Gross Margin %)
Example: CAC 150,000 ₽, ARPA 20,000 ₽/mo, margin 80%.
Payback = 150,000 / (20,000 × 0.8) = 150,000 / 16,000 ≈ 9.4 months.
Why is payback often more important than LTV? LTV is a forecast years into the future, full of assumptions about future churn. Payback is a fact about cash here and now. The longer a customer takes to pay back, the more working capital you tie up and the more vulnerable the company is to cash gaps. An advanced calculation (for example, in SF Education’s calculators) accounts for monthly churn within the payback period — which stretches the timeframe slightly.
Benchmarks: for SMB, payback up to 12 months is considered healthy; for Enterprise, 18–24 months is acceptable given large deal sizes and high retention.
Benchmarks for LTV, LTV:CAC, and payback by segment
Segment benchmarks based on aggregated B2B/SaaS industry data (2024–2026):
| Segment | Typical LTV | LTV:CAC | CAC Payback |
|---|---|---|---|
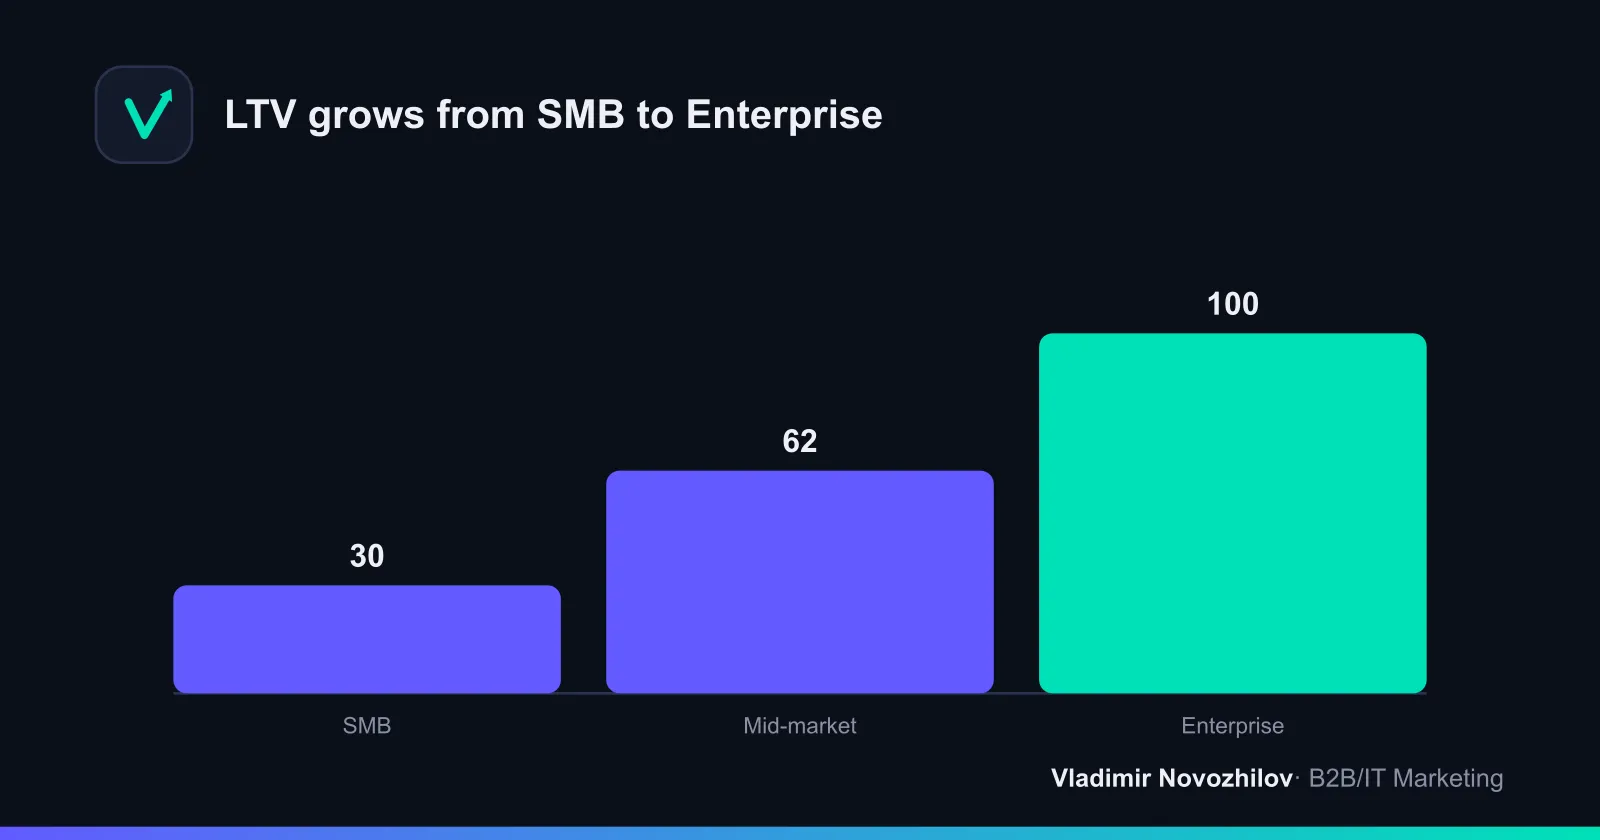
| SMB | $15K–40K | ~2.5:1 | up to 12 mo |
| Mid-Market | $80K–200K | ~3:1–3.5:1 | 12–18 mo |
| Enterprise | $300K–1M+ | ~4.5:1 | 18–24 mo |
| Market median | — | ~3:1 | ~15 mo |
Localization for Russia/CIS: absolute LTV figures on the Russian market are usually lower due to smaller deal sizes and the exchange rate, but the structure and the ratio thresholds hold. Anchor to the 3:1 ratio and the payback period rather than the dollar amounts — those are universal. The commonly accepted minimum healthy threshold is LTV of at least 3× CAC.
B2B specifics: long cycle, sales payroll, NRR, and expansion
In B2B, unit economics has its own quirks that break naive calculations.
Long sales cycle. A customer who paid in March may have started the conversation in November. So costs and customers fall into different periods. Match spend against the cohort of the same deal, or with a shift equal to the average cycle — otherwise CAC will jump from month to month.
Sales payroll in CAC. In B2B, sales means expensive reps, presales, and demos. Their salaries are part of the acquisition cost. Ignoring them means understating CAC several times over.
ACV / TCV. Distinguish ACV (Annual Contract Value) from TCV (Total Contract Value, the full value over the entire term). For a three-year contract worth 3M ₽, ACV = 1M ₽ and TCV = 3M ₽. Calculate LTV and payback consistently in one unit of measure.
NRR / expansion revenue. NRR (Net Revenue Retention) is net retention of revenue accounting for upsells, cross-sells, and churn. NRR above 100% means the base grows even without new customers. It’s precisely expansion revenue (growing income from existing customers) that dramatically increases LTV in Enterprise: the customer not only doesn’t leave but pays more and more. This is one reason why Enterprise can afford longer payback and higher LTV:CAC.
Common mistakes in calculating CAC and LTV
- Counting only advertising in CAC, forgetting payroll, tools, and content.
- Calculating LTV from revenue rather than gross profit — a ~20% overstatement.
- Calculating CAC per lead, not per customer — a gross understatement.
- Mixing blended and paid CAC when making scaling decisions.
- Averaging churn across the whole base instead of a cohort-based calculation.
- Ignoring payback while looking only at a pretty LTV:CAC.
- Matching costs and customers from the same month in B2B with a long cycle.
- Forgetting the Rule of 40 — the sum of growth rate and profitability should be ≥ 40% for healthy SaaS.
Unit-economics checklist for B2B/SaaS
- Gather all acquisition costs for the period: advertising + payroll + tools + content.
- Divide by the number of customers (not leads) → you get CAC.
- Calculate blended and paid CAC separately.
- Determine ARPA and Gross Margin % (accounting for CoGS).
- Take churn for the same period — ideally by cohorts.
- Calculate LTV = (ARPA × GM%) / Churn.
- Divide LTV by CAC — check against the ~3:1 threshold.
- Calculate CAC Payback = CAC / (ARPA × GM%).
- Check payback against the segment norm (<12 mo for SMB).
- For B2B, factor in NRR and expansion — they lift the real LTV.
Unit economics isn’t a one-off report but a regular practice. Calculate metrics by cohorts and segments, honestly attribute all costs, and don’t confuse revenue with profit — then CAC and LTV become a real tool for managing growth, not a decoration for the pitch deck.
FAQ
- What LTV:CAC ratio is considered good for B2B SaaS?
- The benchmark is around 3:1: a customer brings in three times more gross profit than it cost to acquire them. Values below 1:1 mean a loss, 1:1–3:1 is the risk zone, and above 5:1 often signals underinvestment in growth. By industry estimates, the market median sits around 3:1.
- How should you calculate CAC for B2B with a long sales cycle?
- CAC should include not only advertising, but also marketing and sales payroll, commissions, tools, and content. Because of the long sales cycle, costs and customers fall into different periods, so you match spend against customers from the same cohort or with a shift equal to the average sales cycle, rather than month by month.
- What is CAC Payback Period and what timeframe is normal?
- CAC Payback Period is the number of months in which a customer recovers their acquisition cost through gross profit. The formula: CAC / (monthly ARPA × Gross Margin %). The norm for SMB is up to 12 months; for Enterprise, 18–24 months is acceptable.
- Why should LTV be calculated from gross profit rather than revenue?
- A customer brings the company not revenue, but margin after subtracting the cost of serving them (hosting, support, payment fees). Calculating LTV from revenue inflates the result by roughly 20% and distorts the LTV:CAC ratio, which is why the Gross Margin % multiplier must be included in the formula.
- What is the difference between blended CAC and paid CAC?
- Blended CAC is all acquisition costs divided by all new customers, including organic ones. Paid CAC counts only paid channels and the customers acquired through them. Blended shows overall efficiency; paid shows the real return on ad spend for scaling decisions.
- Do LTV:CAC benchmarks differ for SMB, Mid-Market, and Enterprise?
- Yes. Absolute LTV grows from SMB ($15–40K) to Enterprise ($300K–1M+), and the acceptable payback period lengthens as deal size increases. The target LTV:CAC ratio is around 2.5:1 for SMB and up to 4.5:1 for Enterprise, thanks to higher retention and expansion revenue.