Cost Per Lead (CPL): Formula and How to Reduce It


TL;DR
Cost per lead (CPL) is the ratio of channel spend to the number of leads generated, calculated as CPL = ad budget / number of leads. This article covers the basic formula and the margin-based formula, the difference between CPL and CAC, industry benchmarks, common mistakes, and a step-by-step checklist for reducing lead cost without increasing the share of junk leads.
Cost per lead is one of those metrics everyone mentions but few calculate correctly. Below we’ll cover what cost per lead (CPL) is, the formula for calculating it, how to distinguish the actual lead cost from the maximum acceptable one, where the line with CAC lies, and — most importantly — how to reduce cost per lead without turning your flow of inquiries into a flow of junk leads.
What cost per lead (CPL) is and why you should calculate it
Cost per lead (CPL) is the average cost of acquiring one lead: the ratio of ad spend to the number of leads generated over a period. If you spent 120,000 ₽ in a month and got 200 inquiries, your cost per lead would be 600 ₽.
To calculate this correctly, let’s first define what a lead is. A lead is a potential customer who has performed a target action: submitted an inquiry, messaged in chat, called, downloaded a price list, or signed up for a demo. Not every click and not every site visitor — specifically a contact that the sales team can now work with.
Why businesses need to calculate lead cost:
- Assess ROI. CPL is the first indicator of whether advertising fits within your unit economics.
- Compare acquisition channels. The same budget across different channels yields different lead costs and different lead quality.
- Manage pricing and budget. Knowing the maximum acceptable CPL tells you how much you can pay per lead without a loss.
- Spot growth opportunities. Rising CPL is an early sign of creative fatigue, growing competition, or landing page problems.
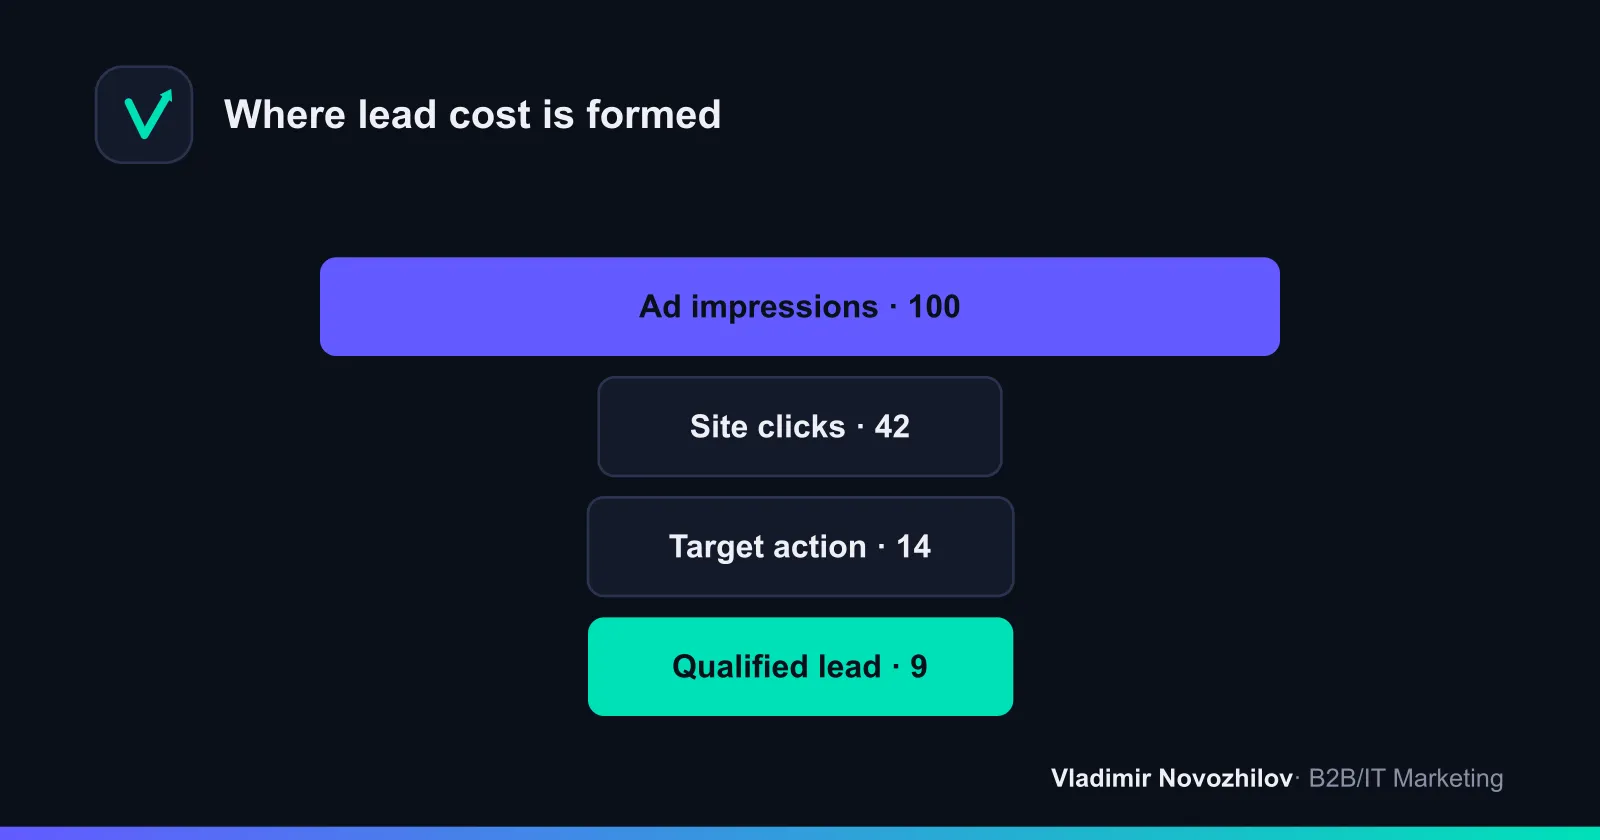
Cost per lead forms across the entire sales funnel: from impressions and clicks to the target action. The higher the conversion rate at each step, the cheaper the final lead becomes for the same budget.
How CPL differs from CAC, CPA, and LTV
These metrics are constantly confused, but the difference is fundamental. In short, regarding the CPL vs. CAC distinction: CPL is the cost of a lead, while CAC is the cost of acquiring a paying customer. Between them stands the sales conversion rate.
| Metric | What it measures | Formula | When to use it |
|---|---|---|---|
| CPL (cost per lead) | Cost of one lead | Budget / number of leads | Evaluating channels at the top of the funnel |
| CPA (cost per action) | Cost of any target action | Budget / number of actions | Clicks, sign-ups, micro-conversions |
| CAC (customer acquisition cost) | Cost of acquiring a customer | Total spend / number of customers | Economics of the whole deal |
| LTV (lifetime value) | Profit from a customer over their lifetime | Average order value × margin × number of purchases | ROI and CAC ceiling |
The logic of this chain is simple: CPL → conversion → CAC → LTV. A cheap lead means nothing if it doesn’t convert. A healthy model is one where LTV exceeds CAC by a significant multiple (usually 3x or more). This is exactly why evaluating advertising by cost per lead alone doesn’t work: what matters is how that lead cost plays out further down the funnel.
The CPL formula: basic and margin-based
There are two distinct tasks here. The first is to find out what a lead actually costs. The second is to understand how much you can afford to pay for it. These require two different CPL formulas.
Basic formula (actual CPL):
CPL = Ad budget ÷ Number of leads
Include everything related to the channel in the budget: ad spend, contractor fees, call tracking, creative production costs. In the lead count, include form submissions, chats, and calls (the latter are usually lost without call tracking).
Margin-based formula (favorable, maximum acceptable cost per lead):
Maximum CPL = Margin per customer × Lead-to-sale conversion rate
This formula answers the question of how much you can afford to pay per lead without going into the red. If the margin per customer is 10,000 ₽ and the lead-to-sale conversion rate is 15%, the maximum lead cost = 10,000 × 0.15 = 1,500 ₽. Anything above that is a loss; anything below is a profit zone.
Comparing actual and favorable cost per lead is the fastest way to tell whether a channel is healthy.
How to calculate actual and favorable cost per lead
Let’s walk through the numbers for both approaches to calculating cost per lead.
Actual CPL. A search advertising channel: budget 90,000 ₽, 150 leads generated. Cost per lead = 90,000 ÷ 150 = 600 ₽.
Favorable CPL. Average order value 40,000 ₽, margin 25% → margin per customer 10,000 ₽. Lead-to-sale conversion rate 12%. Maximum acceptable cost per lead = 10,000 × 0.12 = 1,200 ₽.
Conclusion: the actual 600 ₽ is half the 1,200 ₽ ceiling — the channel is profitable and can be scaled. If the actual figure had been 1,500 ₽, the channel would have been operating at a loss despite a CPL that looks “normal” on the surface.
Step-by-step example: calculating CPL across different channels
Let’s calculate cost per lead across several acquisition channels for the same month — this makes the comparison meaningful.
| Channel | Budget | Leads | CPL | Sales conversion | CAC |
|---|---|---|---|---|---|
| Search (PPC) | 90,000 ₽ | 150 | 600 ₽ | 14% | 4,286 ₽ |
| Social media ads | 60,000 ₽ | 200 | 300 ₽ | 6% | 5,000 ₽ |
| SEO (organic) | 40,000 ₽ | 120 | 333 ₽ | 18% | 1,851 ₽ |
| Email and CRM campaigns | 15,000 ₽ | 50 | 300 ₽ | 22% | 1,364 ₽ |
What this table shows: social ads have the lowest lead cost (300 ₽) but the worst CAC (5,000 ₽) due to weak conversion — a classic sign of junk leads. Meanwhile, email and SEO, at a similar or slightly higher CPL, deliver customers 2–3 times cheaper. This is exactly why looking at cost per lead alone isn’t enough — you need to pair it with conversion and CAC.
Table: CPL benchmarks by industry
There’s no single “correct” cost per lead, but industry benchmarks are useful for checking whether you’re overpaying. The ranges below are averaged benchmarks for the Russian market; the exact figure in your niche depends on order value and competition.
| Industry | CPL benchmark | Comment |
|---|---|---|
| E-commerce (low-cost goods) | 100–600 ₽ | High volume, low order value, site conversion matters most |
| Consumer services | 300–1,500 ₽ | Home repair, beauty, education — strong seasonality |
| B2B and IT | 1,500–8,000 ₽ | Long deal cycle, high average order value |
| Real estate | 2,000–10,000 ₽ | High lead cost justified by large margins |
| Finance and B2B services | 1,000–6,000 ₽ | Intense competition for the target audience |
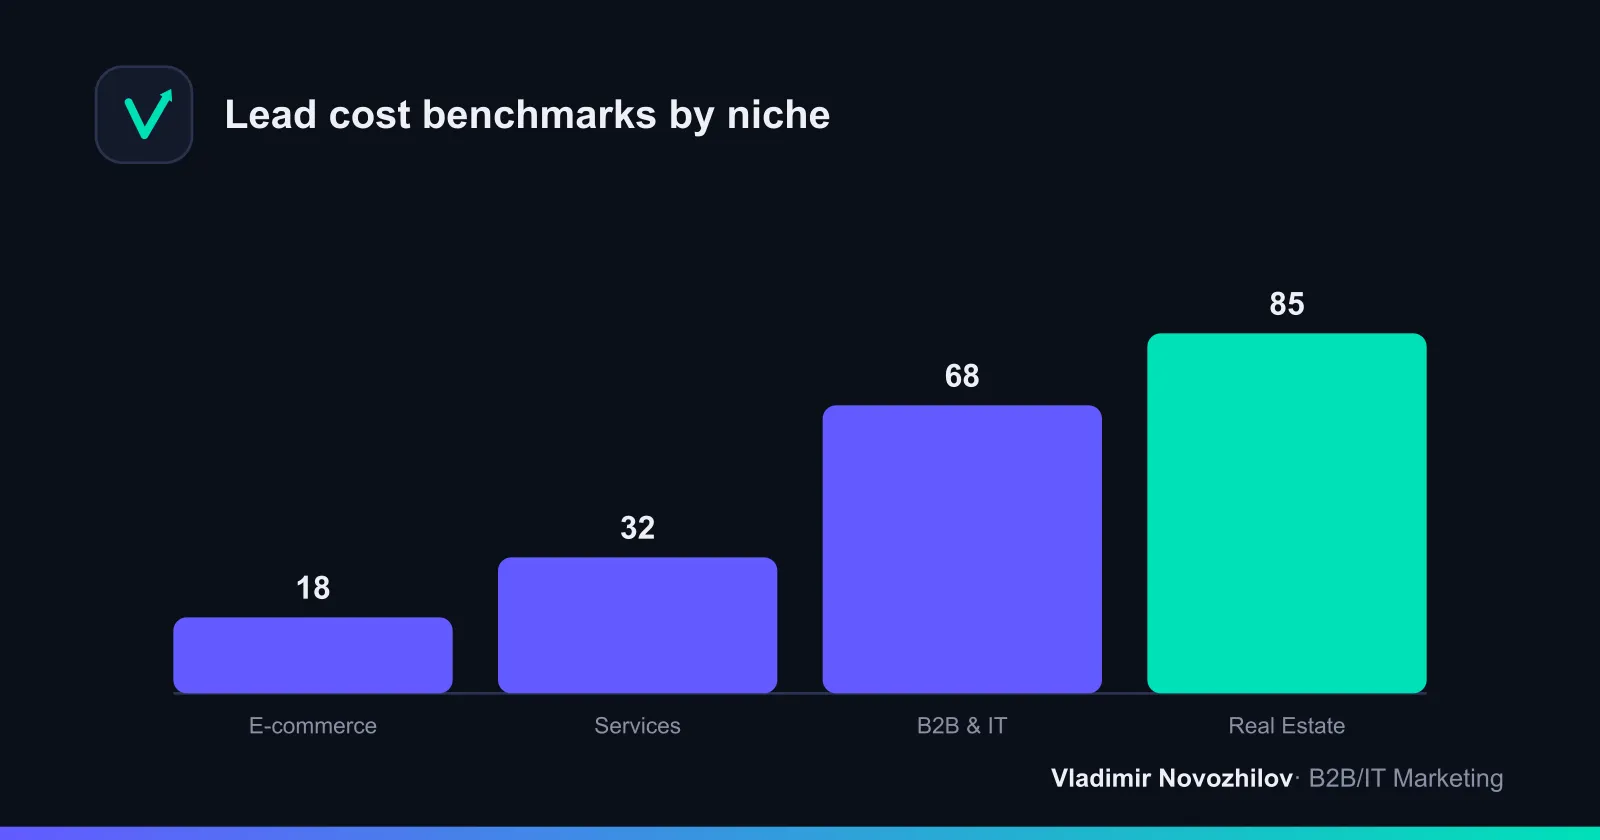
The key rule when reading this table: don’t compare your CPL to a different niche — compare it to your own margin. A 6,000 ₽ lead in B2B and IT is normal, but in e-commerce with a 2,000 ₽ order value, it’s a disaster.
What factors affect cost per lead
Lead cost isn’t constant — it’s shaped by several factors:
- Competition in the niche. The more advertisers bidding in the auction, the more expensive the click — and consequently, the lead.
- Marketing channel. Search, social, SEO, and email deliver fundamentally different lead cost and quality.
- Offer quality. A weak offer lowers conversion — the same traffic yields fewer inquiries and a higher CPL.
- Targeting precision. Missing the target audience inflates the budget and generates junk leads.
- Landing page. A slow or unconvincing landing page kills click-to-lead conversion.
- Seasonality. During peak demand, auctions get more expensive, but conversion often rises too.
- Creative fatigue. Over time an ad wears out, CTR drops, and cost per lead rises.
How to properly collect data for calculating CPL
Bad data means bad decisions. To make your CPL calculation reliable:
- Set up end-to-end analytics. Inquiries, chats, and calls should flow into a single system.
- Set up call tracking. Otherwise phone leads will drop out of the denominator, inflating your lead cost.
- Track leads in a CRM system. Only there can you see which channel produced not just an inquiry but an actual deal.
- Tag traffic with UTM parameters. Without tagging, you can’t separate acquisition channels.
- Calculate over a single period. Use budget and lead figures from exactly the same time frame.
It’s useful to set up a simple template for tracking CPL by channel, with columns: channel, budget, leads, CPL, qualified leads, deals, conversion rate, CAC. Such a template can be built in 15 minutes in any spreadsheet and updated weekly; it replaces any paid calculator and immediately shows where lead cost is exceeding normal ranges.
Top 10 ways to reduce cost per lead
Reducing cost per lead doesn’t just mean cutting the budget. The goal is to lower the price per lead while maintaining or improving its quality. A practical checklist:
- Cut underperforming channels and campaigns. Reallocate budget toward channels with the best CAC, not just the cheapest CPL.
- Boost landing page conversion. Speed up load times, simplify the form, strengthen the offer — this is the fastest lever to pull.
- Run A/B tests. Test headlines, creatives, forms, and buttons — even a +2% lift in conversion noticeably lowers lead cost.
- Refine your targeting. Exclude non-relevant segments so you’re not paying for junk leads.
- Manage negative keywords and placements. In search and display networks, cleaning up queries and placements quickly cuts wasted spend.
- Use retargeting. Bringing back a warm audience is almost always cheaper than acquiring a new one.
- Refresh creatives regularly. New ads maintain CTR and prevent CPL from rising due to fatigue.
- Nurture leads via email and CRM. Reactivating your database generates inquiries with almost no ad spend.
- Improve lead qualification. Filter out non-target inquiries upfront so the sales team doesn’t waste time.
- Automate marketing. Auto-funnels, chatbots, and trigger-based scenarios reduce handling costs and lead price.
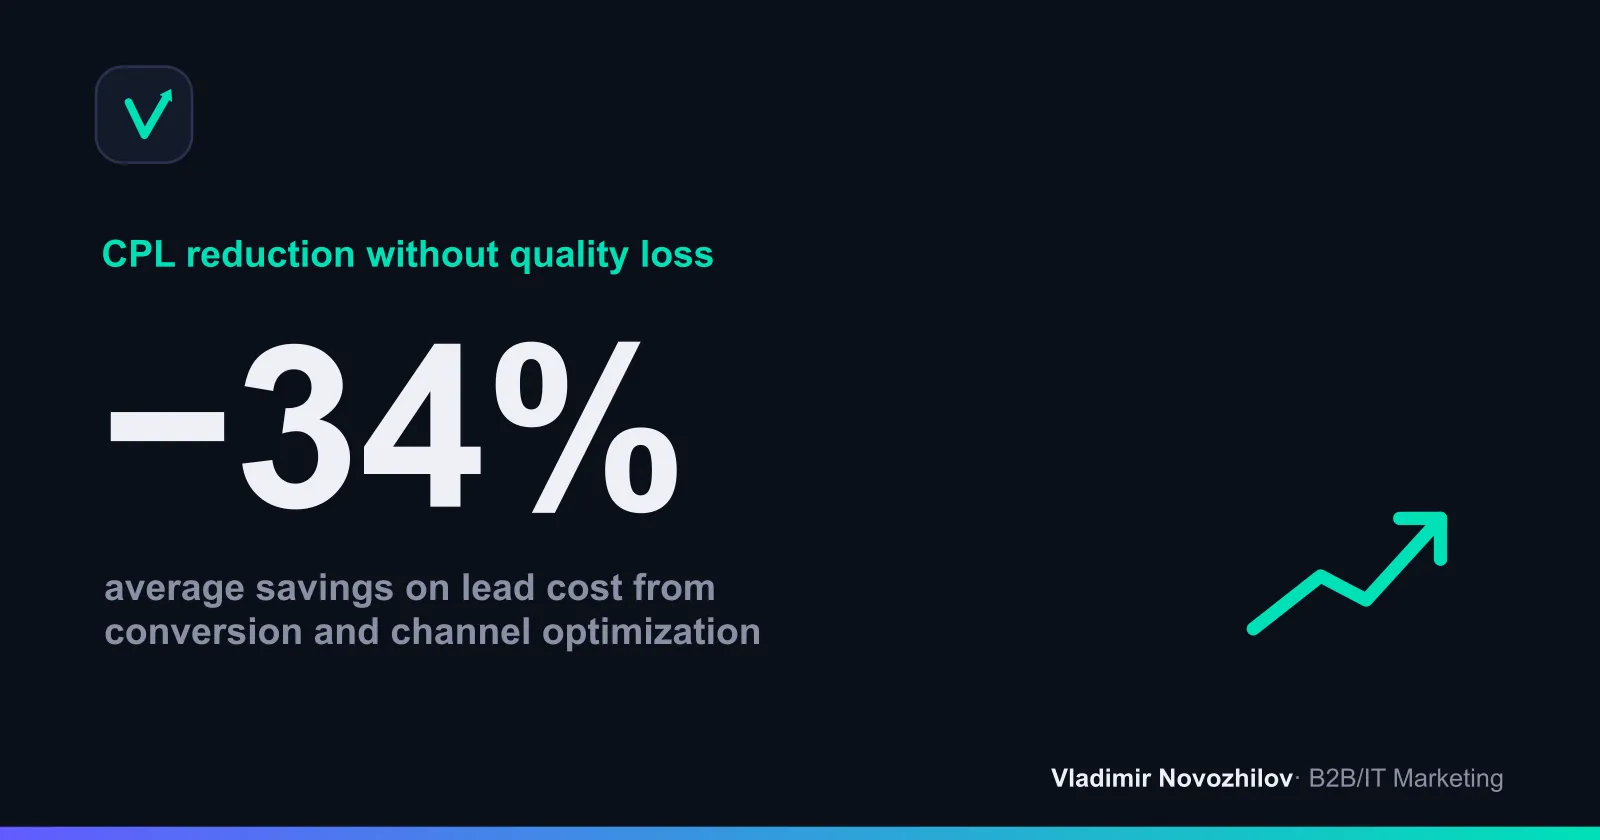
An important principle: don’t optimize CPL in isolation — optimize the chain “lead cost → conversion → CAC.” Sometimes it’s actually better to raise cost per lead by 20% if it doubles the sales conversion rate and lowers CAC.
Common mistakes when calculating cost per lead
- Lumping everything into one pool. A single averaged CPL across all channels hides both unprofitable and profitable sources.
- Forgetting about calls. Without call tracking, the lead count is understated and lead cost is inflated.
- Ignoring quality. A cheap CPL with a flood of junk leads is more expensive than it appears.
- Mixing time periods. Monthly budget against quarterly leads produces a meaningless number.
- Not accounting for all costs. The budget often excludes contractor fees, tools, and creative production.
- Stopping at CPL. Failing to carry the calculation through to CAC and reconcile it with margin and LTV.
- Confusing a lead with a customer. Calculating cost per lead but calling it cost per customer.
Tools for calculating and reducing CPL
Instead of calculating manually, businesses typically use a combination of tools:
- Ad platform dashboards — raw data on budget and inquiries.
- Web analytics systems — conversions, traffic sources, on-site behavior.
- Call tracking — counting calls as leads tied back to their channel.
- CRM system — the path from lead to deal and CAC calculation.
- End-to-end analytics — consolidating all data into a single CPL and ROI report.
A simple spreadsheet is often sufficient as a calculator: the CPL formula plus a sample table by channel covers 90% of what small and mid-sized businesses need.
Checklist: how to optimize CPL in 30 days
Week 1 — Audit. Consolidate data from all channels into one spreadsheet, set up call tracking, verify UTM tagging, and calculate actual CPL and CAC for each source.
Week 2 — Cleanup. Turn off campaigns with a CAC above margin, add negative keywords, remove underperforming placements, rework your worst ads.
Week 3 — Conversion. Run A/B tests on landing pages and forms, simplify the path to the target action, add retargeting for warm audiences.
Week 4 — Scaling. Shift budget toward channels with the best CAC, turn on nurturing via email and CRM, lock in new CPL benchmarks and update your tracking template.
With a month of this kind of work, it’s realistic to cut cost per lead by 20–35% while maintaining quality — primarily through better conversion and budget reallocation, not by cutting corners on channel spend.
Key takeaways
Cost per lead (CPL) is a fundamental metric for advertising ROI, but on its own it carries limited meaning. Calculate the actual lead cost from your budget, check it against the margin-based favorable threshold, always carry the calculation through to CAC, and compare it with LTV. That way, you’ll make decisions based on real profit rather than a flattering CPL number — and you’ll cut cost per lead exactly where it genuinely improves your unit economics.
FAQ
- How does cost per lead (CPL) differ from customer acquisition cost (CAC)?
- CPL is the price of a single lead (a contact who took a target action), while CAC is the cost of acquiring one paying customer. The difference matters because not every lead buys: if CPL = 500 ₽ and the lead-to-sale conversion rate is 20%, CAC for that channel is roughly 2,500 ₽ plus sales team costs. CPL shows the efficiency of advertising at the top of the funnel, while CAC reflects the economics of the entire deal. Judging a channel by CPL alone is risky: a cheap lead can produce an expensive customer.
- How do you know a lead is too expensive?
- A lead is too expensive when the channel's CAC approaches the margin from the first sale or the customer's LTV. A simple rule: the maximum acceptable (favorable) cost per lead = margin per customer × lead-to-sale conversion rate. If actual CPL exceeds this threshold, the channel is unprofitable. For example, with a margin of 10,000 ₽ and a 15% conversion rate, the maximum CPL is 1,500 ₽; anything above that works at a loss.
- What is a normal cost per lead across different niches?
- There's no single benchmark — lead cost depends on the niche, average order value, and competition. Rough guidelines: e-commerce with low-cost items — 100–600 ₽; consumer services — 300–1,500 ₽; B2B and IT — 1,500–8,000 ₽; real estate — 2,000–10,000 ₽. What matters more than the absolute number is the ratio of CPL to margin: a 5,000 ₽ lead is profitable with a deal size in the hundreds of thousands, but a loss at a 3,000 ₽ ticket size.
- Should VAT be factored into cost-per-lead calculations?
- Calculations should be consistent. If you take the ad budget including VAT, calculate the margin for the favorable CPL threshold including taxes as well — otherwise the comparison gets distorted. For internal channel efficiency assessments, figures excluding VAT are more commonly used, as they make it easier to compare costs and gross profit correctly. The key is not to mix tax-inclusive and tax-exclusive figures in the same calculation.
- How should inbound calls be factored into CPL calculations?
- A call from an ad is also a lead, so it must be included in the denominator of the formula. This requires call tracking: dynamic number insertion shows which channel and ad drove the call. Without call tracking, calls get lost, the lead count is understated, and the calculated CPL is inflated. Count form submissions, chats, and calls together — only then will the channel's cost per lead be accurate.
- What should the lead-to-sale conversion rate be?
- A healthy lead-to-sale conversion range is 10–30% for most niches, though it depends on lead quality and deal length. In B2B and IT with long sales cycles, 5–15% may be normal, while services with hot demand can see 25–40%. Low conversion combined with a cheap CPL often signals junk leads: the channel delivers volume but not the right people. Always look at CPL and conversion together.