ROI and ROMI in Marketing: How to Measure Payback

TL;DR
ROI measures the payback on all business investments; ROMI covers marketing spend only. The formula is ROMI = (Marketing revenue − Marketing spend) / Spend × 100%. To keep the numbers honest, calculate revenue as gross profit and connect the math to end-to-end analytics: UTM → lead in CRM → deal → payment → report by channel, factoring in your attribution model.
Marketers love pretty dashboards, but the owner needs one answer: is marketing bringing in money or burning the budget? Two metrics answer that question — ROI and ROMI. Let’s break down the formulas, work through an honest B2B/SaaS example with real numbers, and — most importantly — see how to connect the math to end-to-end analytics so the numbers don’t lie.
What ROI and ROMI Are: Definitions and the Key Difference
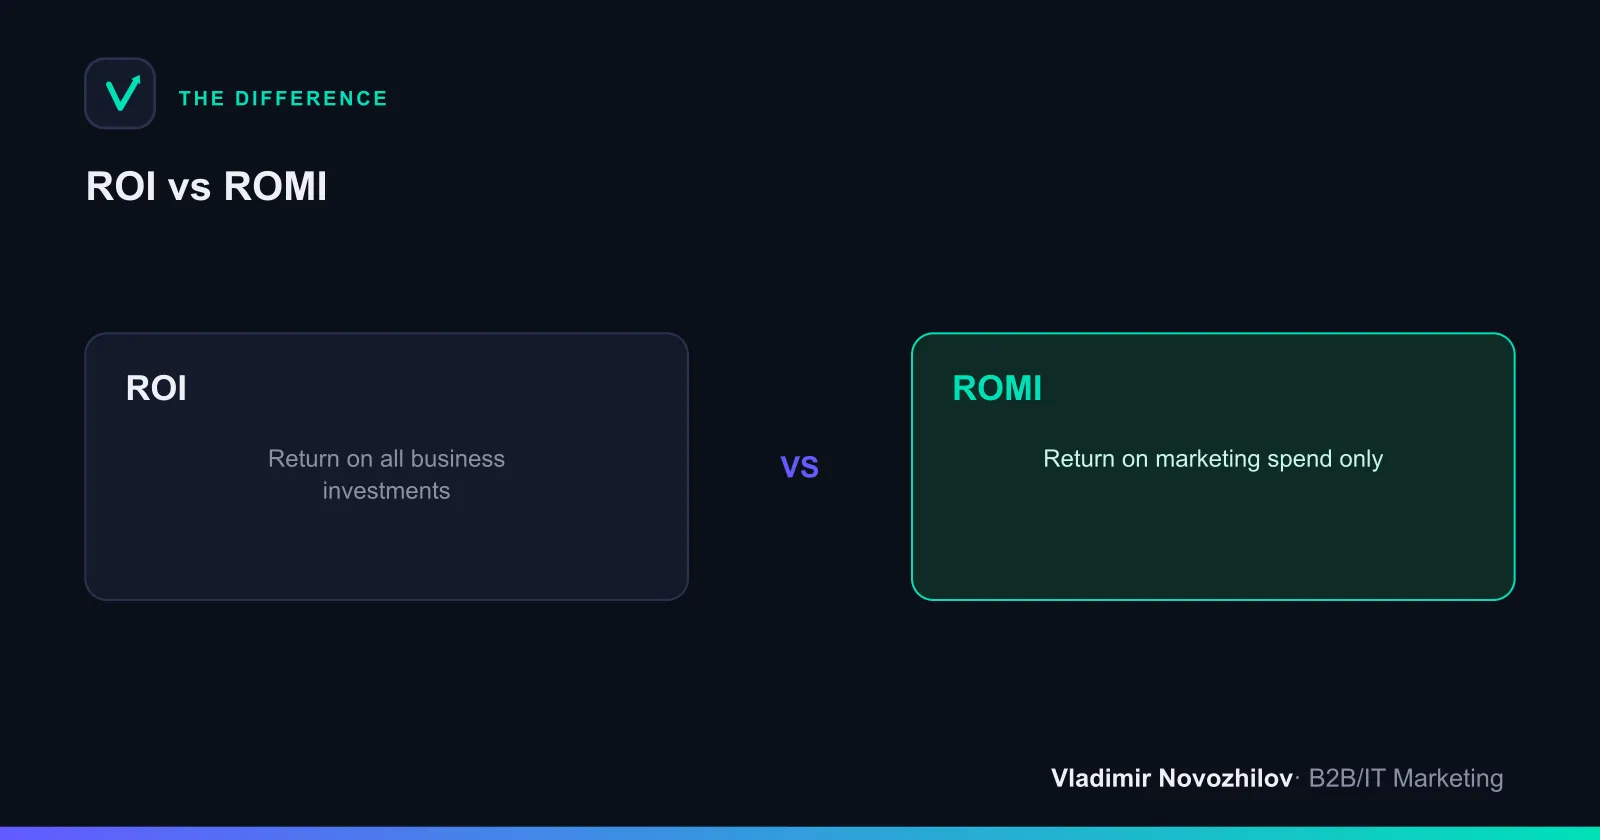
ROI (Return on Investment) is the payback ratio on all investments in the business. It accounts for not just advertising but also cost of goods, salaries, rent, and logistics. ROI answers the question: how much profit did every ruble put into the business return over the period.
ROMI (Return on Marketing Investment) is a special case of ROI where the costs include marketing spend only: ad budgets, contractor fees, services, and tools. ROMI shows the payback of marketing specifically and lets you compare channels against one another.
The key difference is simple: ROI looks at the whole business, ROMI only at marketing. The formula is the same; what differs is the set of costs in the denominator.
ROI and ROMI Formulas: How to Calculate Them Correctly
The text formulas worth memorizing:
- ROI = (Revenue − Costs) / Costs × 100%, where Costs are all the business’s expenses.
- ROMI = (Marketing revenue − Marketing spend) / Marketing spend × 100%.
An important nuance: by “Revenue” you should correctly understand not top-line revenue but gross (margin) profit. That mistake gets its own section below.
Interpreting the result:
- ROMI = 0% — marketing broke even exactly, returning what was invested.
- ROMI > 100% — every ruble came back with a ruble of profit on top, or more.
- ROMI < 0% — you’re in the red, the channel is unprofitable.
ROI vs ROMI vs ROAS: Comparison Table
The three metrics are often confused. The difference lies in what sits in the numerator and the denominator.
| Metric | Numerator | Which costs | The question it answers |
|---|---|---|---|
| ROI | Profit | All business expenses | Is the business making money overall |
| ROMI | Profit from marketing | Marketing only | Is marketing paying off, and which channels |
| ROAS | Ad revenue | Ad budget only | How effective a specific ad is |
The key distinction of ROAS: it’s calculated on revenue and ignores cost of goods. A ROAS of 300% can hide a loss if the product’s margin is below 33%. That’s why ROAS is an operational metric for bid optimization, while payback decisions are made on ROMI and ROI.
Step-by-Step ROI and ROMI Calculation Example (B2B/SaaS Case)
Take a SaaS product with a subscription of 50,000 ₽/year and an 80% margin.
Given, for the quarter, on the “paid search” channel:
- Marketing spend: 600,000 ₽ (budget + agency).
- Paid customers acquired: 30 clients.
- Revenue: 30 × 50,000 = 1,500,000 ₽.
- Gross profit: 1,500,000 × 80% = 1,200,000 ₽.
We calculate ROMI on profit:
ROMI = (1,200,000 − 600,000) / 600,000 × 100% = 100%.
If we had calculated it wrongly on revenue:
ROMI = (1,500,000 − 600,000) / 600,000 × 100% = 150%.
The 50-percentage-point gap is exactly the cost of the methodological error. On revenue the channel looks noticeably more profitable than it actually is.
Gross Profit or Revenue: A Common Mistake in Calculating the Return
The most widespread mistake is plugging revenue into the numerator. You can’t do that: revenue ignores cost of goods. The lower the margin, the more revenue overstates the payback.
The rule: in ROMI, plug in gross (margin) profit — revenue minus the cost of goods sold. Then the metric shows real money, not turnover. Net profit (after all operating expenses) is usually used for the ROI of the business as a whole, not for comparing channels.
How to Connect ROI to End-to-End Analytics: From Click to Report
End-to-end analytics is a system that links ad spend to actual sales and lets you calculate ROMI automatically for each channel. Without it, the calculation turns into manually reconciling spreadsheets riddled with errors.
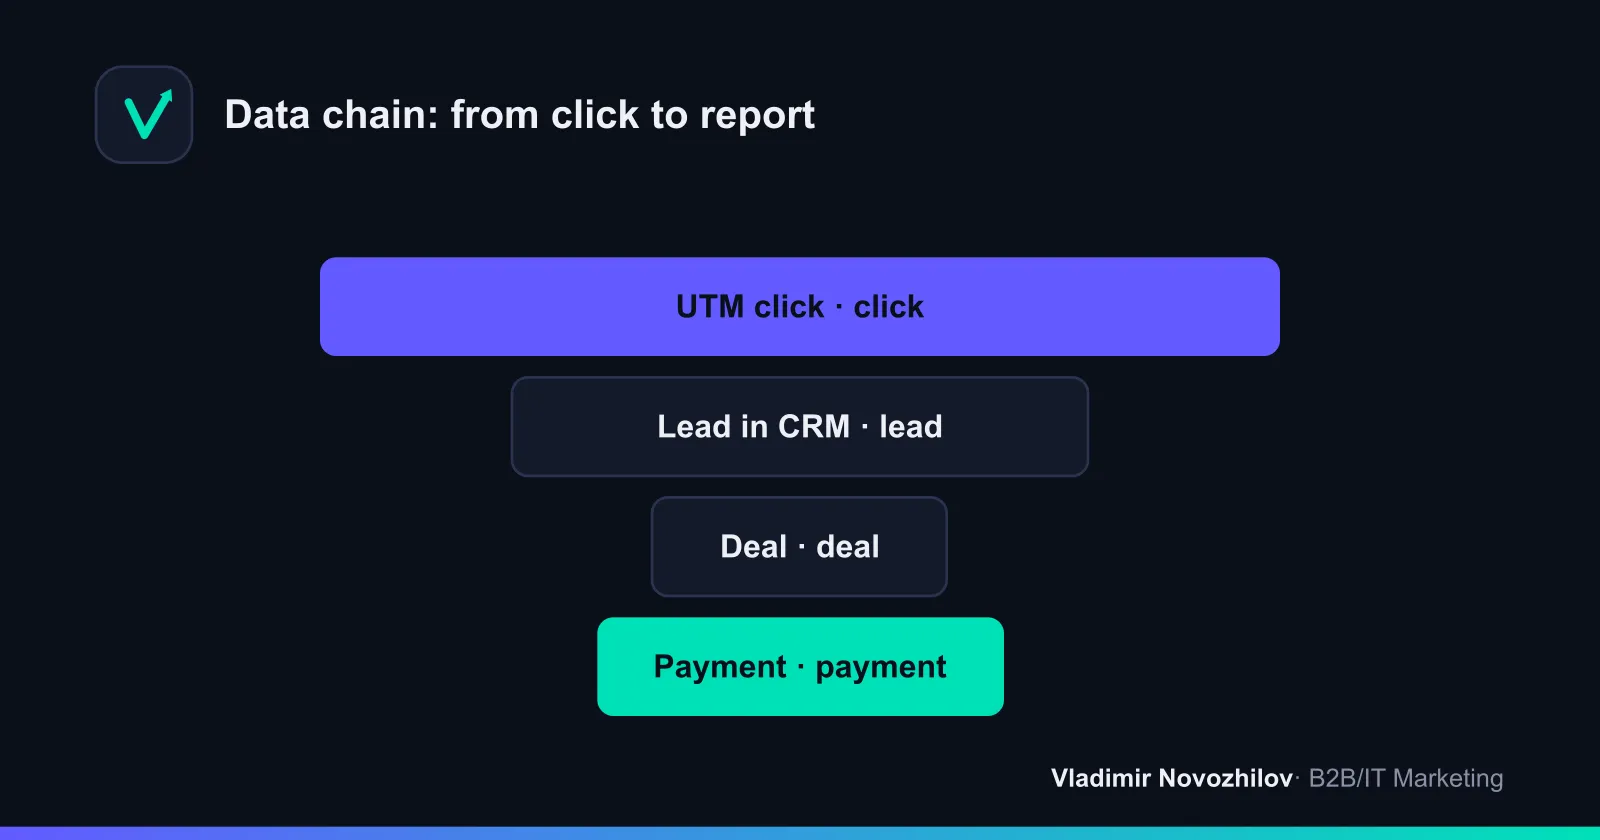
The connection algorithm:
- Tag traffic with UTM parameters. Each campaign, ad, and channel gets a unique utm_source, utm_medium, utm_campaign.
- Capture UTMs into the lead. The form, chat, and call tracking write the tags into the lead’s record in the CRM. For calls, dynamic call tracking is a must.
- Move the deal through the pipeline. The lead becomes a deal with stages: qualification, pipeline, invoice, payment. The UTM “travels” along with the deal.
- Record the payment. The amount and date of payment are pulled from the CRM or billing and tied back to the original source.
- Build a report by channel. The system reconciles spend (from ad platforms) and revenue (from the CRM) and calculates ROMI, CPL, and CAC for each source.
Once it’s set up, you get not an abstract “average ROMI” but a breakdown: which channel turns a profit and which one eats into it.
Attribution Models and Their Effect on ROI by Channel
An attribution model is the rule by which the value of a conversion is distributed among a customer’s touchpoints with the brand. The choice of model directly determines the ROMI of each channel.
- First-click — all the value to the first touch. Overvalues the top of the funnel.
- Last-click — all the value to the last touch. Devalues content and reach channels.
- Linear attribution — value is split equally across all touches.
- Data-driven attribution — the algorithm distributes weight by the real contribution of each touch, based on data.
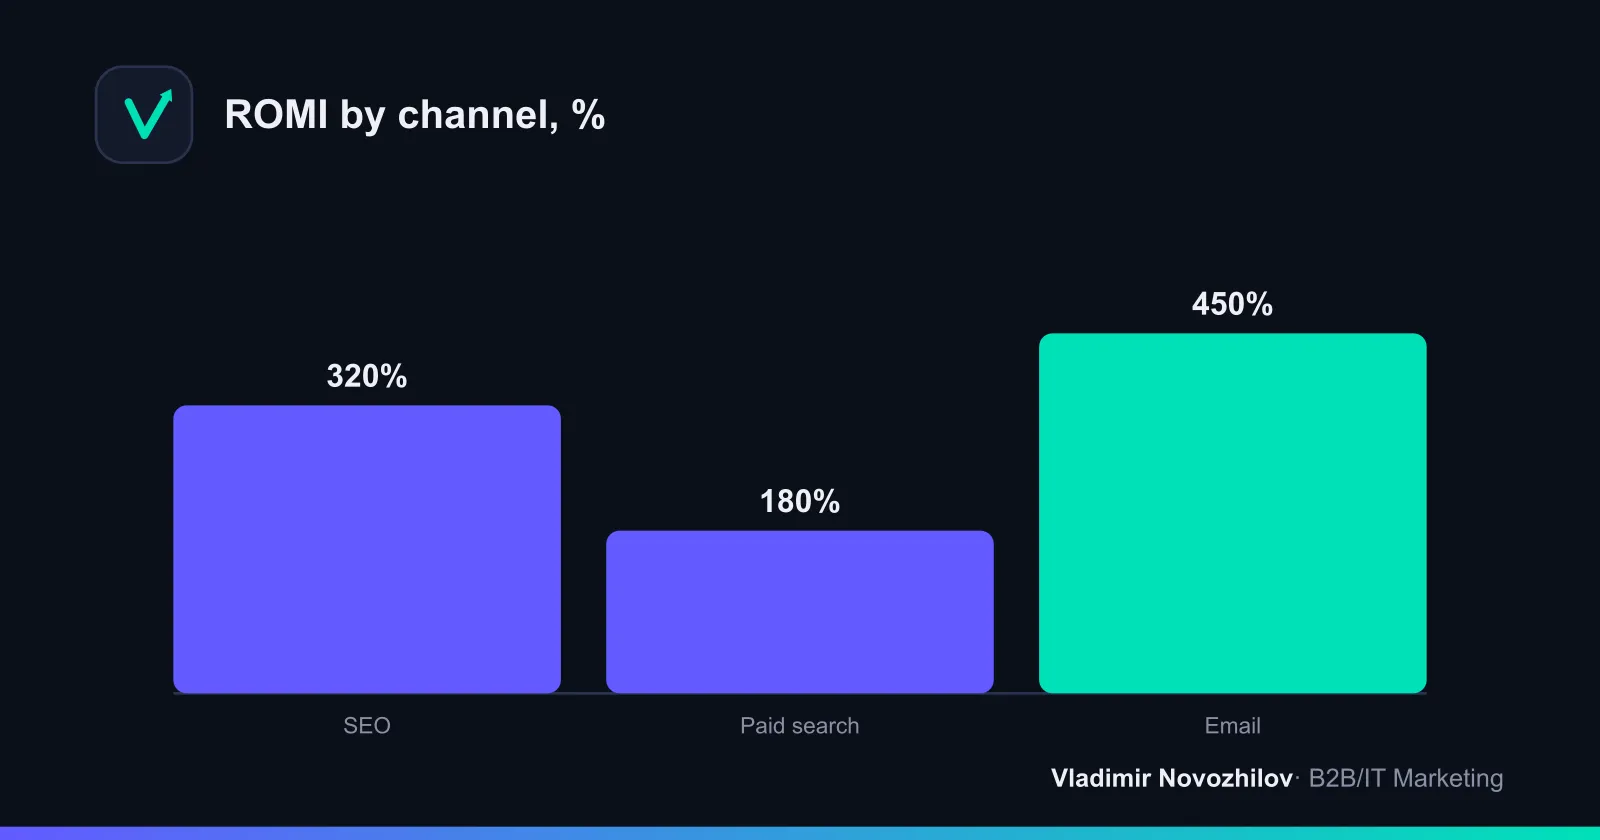
In B2B, where there can be 7–15 touches before a deal, last-click systematically “kills” content marketing and webinars, even though they set the deal in motion. For long funnels, linear or data-driven give a fairer picture of ROI by channel.
ROI in B2B With a Long Deal Cycle: How to Calculate It Correctly
In B2B and SaaS the deal cycle stretches over months, so payment arrives in a different period than the one the budget was spent in. A direct “March spend / March payments” calculation will produce a false loss.
What to do:
- Calculate by cohorts. Tie revenue to the month the lead was acquired, not the month it paid.
- Watch the pipeline. Count the value of open deals adjusted for close probability by stage.
- Lean on LTV. The first payment often fails to recover CAC — payback comes later, so it makes sense to build a projected customer LTV into ROMI.
ROI, LTV, CAC, and Payback Period: A Single Unit-Economics System
ROMI doesn’t live in a vacuum. It’s part of unit economics — a set of metrics that together show whether the growth model is healthy:
- CAC (Customer Acquisition Cost) — the cost of acquiring a customer.
- LTV (Lifetime Value) — the total profit from a customer over their entire lifetime.
- Payback Period — the time it takes a customer to recover their CAC.
Benchmarks for SaaS: an LTV/CAC ratio of ≥ 3, a Payback Period of ≤ 12 months. If a channel’s ROMI is negative on the first payment but the LTV/CAC is healthy, the channel can still be profitable — it just pays back over several subscription cycles. That’s why looking at ROMI in isolation is dangerous in B2B.
Common Mistakes in Calculating ROI and ROMI
- Calculating the return on revenue instead of gross profit.
- Forgetting hidden costs: team salaries, tool costs, fees.
- Using last-click in a long B2B funnel and zeroing out upper-funnel channels.
- Reconciling spend and sales by hand across different spreadsheets with no single source.
- Ignoring delayed conversions and measuring ROMI within the bounds of a single month.
- Demanding a positive ROMI from brand and reach activities whose effect shows up only through LTV.
ROMI Benchmarks by Industry: What to Aim For
There’s no universal “good” number — it all comes down to margin. General reference points:
- E-commerce, low margin: you need a ROMI of 300–500%, otherwise there’s almost no profit.
- Services, mid margin: 150–300% is considered healthy.
- B2B SaaS, high margin and LTV: a ROMI of 50–150% on the first payment is acceptable with a good LTV/CAC.
Instead of chasing someone else’s benchmarks, calculate your own threshold: the ROMI at which you cover CAC within your target Payback Period.
Tools for the Calculation: Excel, BI Dashboard, End-to-End Analytics
- Excel/Google Sheets — fine for getting started and for one-off calculations. The ROMI formula fits in a single cell, but reconciling data by hand doesn’t scale.
- End-to-end analytics (Roistat, CRM-based analytics) — automatically links spend and sales and calculates ROMI by channel with attribution taken into account.
- BI dashboard — the top layer: it pulls data from the CRM, ad platforms, and billing into live reports for the team and leadership.
The logical path: start with Excel to grasp the methodology, then move the calculation into end-to-end analytics and surface the key metrics on a BI dashboard.
In Short: The Essentials on ROI and ROMI
- ROI measures the payback of the whole business, ROMI only of marketing; the formula is one and the same, the costs in the denominator differ.
- ROMI = (Marketing revenue − Costs) / Costs × 100%, and revenue is taken as gross profit, not top-line revenue.
- ROAS is calculated on revenue and ad budget — it’s an operational metric, not a measure of profitability.
- An honest ROMI by channel is only possible through end-to-end analytics: UTM → lead in CRM → deal → payment → report with the correct attribution model.
- In B2B with a long deal cycle, calculate by cohorts and connect ROMI to LTV, CAC, and Payback Period — otherwise the metric is misleading.
FAQ
- How does ROI differ from ROMI?
- ROI (Return on Investment) measures the payback on every investment in the business — product, salaries, rent, logistics. ROMI (Return on Marketing Investment) is a special case of ROI where the costs include marketing spend only: advertising, contractors, tools. The formula is the same; what differs is the set of costs in the denominator.
- What counts as a good ROMI?
- ROMI = 0% means marketing broke even, returning what was invested. Anything above 100% is usually seen as a healthy result, but the benchmark depends on the industry and margin. In low-margin e-commerce you need a ROMI of 300–500%, while in high-margin B2B SaaS with strong LTV even 50–150% can be positive. Anchor to your own unit economics rather than averaged figures.
- How do you calculate ROI when the B2B deal cycle runs several months?
- Use a cohort approach: tie revenue to the month the lead was acquired, not the month it paid. Calculate ROMI on the cohort's closed deals and look at the pipeline in parallel — the value of open deals weighted by close probability. For an honest picture, bring in LTV, because in SaaS the first payment often fails to recover CAC and payback arrives only after the Payback Period.
- Should ROI be calculated on net profit or on revenue — what's correct?
- Calculating on revenue is the most common mistake. The correct calculation uses gross profit: cost of goods sold is subtracted from revenue. Otherwise high revenue at a low margin creates the illusion of profitable marketing. Ideally, for ROMI you take margin profit before marketing costs themselves are deducted.
- How does attribution affect ROI by channel?
- The attribution model decides which channel gets credited with a conversion. Under last-click, all the credit goes to the final touch, which makes upper-funnel channels (reach, content) look unprofitable. First-click overvalues the funnel entry. Linear and data-driven distribute value across every touch and give a fairer ROI by channel, especially in B2B with a long chain of contacts.
- How does ROI differ from ROAS?
- ROAS (Return on Ad Spend) is calculated on revenue and on ad spend only: ROAS = Ad revenue / Ad spend × 100%. It ignores cost of goods and profit, so it shows the effectiveness of the advertising, not the business. ROI and ROMI are calculated on profit and answer whether you are making or losing money.