How to Measure Content: Reach, Engagement, Conversions, and ROI


TL;DR
Content metrics are easiest to analyze in four groups: reach (views, visitors, impressions), engagement (depth, scroll, time), conversions (leads, inquiries, target actions) and money (ROI, CAC, LTV, revenue). For external publications add PR indicators — PR Points, MediaIndex and citation index. Choose metrics by goal and funnel stage — don’t try to measure everything at once.
Any content report answers one question: does the content work for the business. It’s convenient to look at the numbers through four groups: reach (how many people saw the material), engagement (do they finish reading or watching), conversions (does it lead to inquiries) and money (do the investments pay off). For external publications add PR metrics — PR Points, MediaIndex and citation index. Below — how to pick indicators by goal, formulas to calculate them, which benchmarks to consider normal, and which tools to collect the data.
Immediate important point: don’t try to track everything. Most B2B, IT and service teams have resources for 6–8 key indicators. Your task is to choose those tied to the current goal and monitor them regularly, not to fill a pretty but useless table of thirty numbers.
Why content marketing is hard to measure with ordinary metrics
The difficulty is that content influences the decision not directly and not immediately. A person can read an article on Monday, return a month later via a branded search and leave an inquiry from an ad. Formally the inquiry “came from paid,” while the first and decisive touch was the article. That’s an attribution problem — because of it content’s contribution is often underestimated.
Second reason — delayed effect. In performance channels money on input yields leads the same day. Content marketing is cumulative: organic search usually ramps up over 3–6 months, and full ROI in niches with long sales cycles appears in six months to a year.
Third reason — part of content’s value isn’t expressed in clicks. Awareness, trust, brand mentions in other articles and in neural network answers — all influence sales but don’t fit into a single report line. Therefore content effectiveness is assessed by a combination of metrics at different levels, not by one number.
Attribution — the rule that assigns a conversion to a channel. Last‑click credits the last touch, first‑click the first, and distributed models account for the entire path. For content it’s more important to look at assisted conversions, not only last‑click.
Mini‑FAQ for this section
Does this mean content cannot be measured? No. It can, but comprehensively: combine quick reach and engagement metrics with conversion and financial indicators, and evaluate results over quarters, not weeks.
How to choose metrics by goal and funnel stage
Before opening analytics, answer why you need a specific piece of content. The goal determines which numbers make sense.
- Awareness and top of funnel. Look at views, unique visitors, social reach, brand traffic. Expecting inquiries from a generic “what is X” article is pointless — its job is to bring people and be memorable.
- Nurture and middle of funnel. Important are view depth, scroll depth, time on page, share of returning visitors, newsletter signups. The material should retain attention and lead further.
- Conversion at the bottom of funnel. Case studies, comparisons, calculations — these are expected to deliver leads and inquiries. Evaluate conversion to the target action, cost per lead, number of deals.
- External publications and PR. For guest posts and media — number of publications, PR Points, MediaIndex, citation index and referrals from placements.
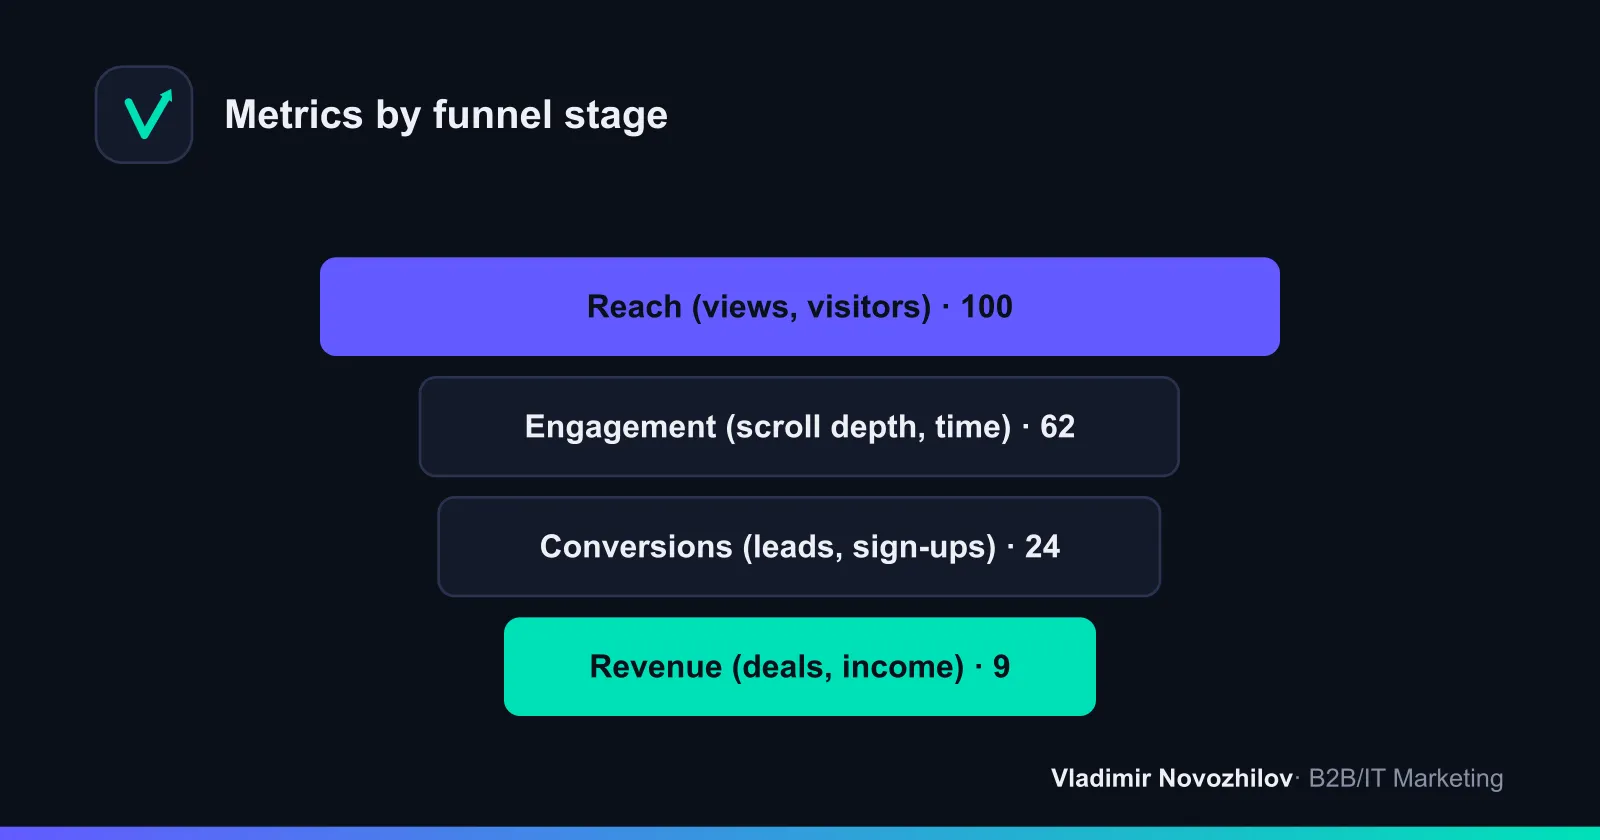
The logic is simple: each funnel stage has its own set of content‑marketing KPIs. “Measure correctly” means matching the metric to the purpose of the piece, not measuring everything with one ruler.
Mini‑FAQ for this section
Where to start if you measured nothing before? Take three indicators: traffic to the article, conversion to the target action and number of leads from content. That’s enough for the first month, then expand the set.
Reach and visibility metrics: views, visitors, impressions
Reach metrics show how many people had contact with your content. This is the top level of evaluation — not about money, but about audience scale.
- Page views — how many times the material was opened. One person can generate multiple views.
- Unique visitors — how many distinct people visited. A more honest reach metric than views.
- Reach on social networks and platforms — how many people saw the post or announcement in feeds.
- Regional reach — which cities and countries the audience comes from; important if you operate in specific geographies.
- Share of returning users — how many readers return. Indirectly shows content value.
Reach — the number of unique users who saw the material. Don’t confuse with impressions: one person can produce multiple impressions but counts once in reach.
Example calculation. An article gathered 8,400 views and 6,100 unique visitors in a month. So on average one person opened the material 1.38 times (8,400 / 6,100). Share of returning users — 14%. For a B2B expert longread this is a normal level: people save such articles and return.
Where to look: Yandex.Metrica and GA4 for the site, built‑in statistics of platforms and social networks for external placements. Reach metrics are easy to inflate with clickbait headlines, so don’t evaluate them in isolation from engagement.
Mini‑FAQ for this section
Lots of traffic but no inquiries — is that a failure? Not necessarily. The material may be top‑level and work for awareness. Check whether it leads readers further down the funnel, and don’t expect conversions from overview articles.
Engagement metrics: bounce rate, page depth, scroll, time on site
Engagement metrics answer whether people actually read your content or close it on the second paragraph. This is an underestimated group, though it’s what tells you what to improve.
- Bounce rate — share of visits where the person left without actions. High bounce on a long article often means the headline promised one thing and the text delivered another.
- Page depth — how many pages a person viewed per visit. Shows whether content leads deeper into the site.
- Scroll depth — how far down the page readers go. In Yandex.Metrica it’s visible via the scroll map: if 70% leave on the first screen, the problem is in the introduction.
- Time on site / on page — minutes spent reading. For a 2,500‑word longread a healthy average is 3–5 minutes.
- Reactions: comments, shares, ratings — direct signals that the material resonated.
Scroll depth — a metric showing how deep a user scrolls on a page. It helps find where readers lose interest and elevate key blocks.
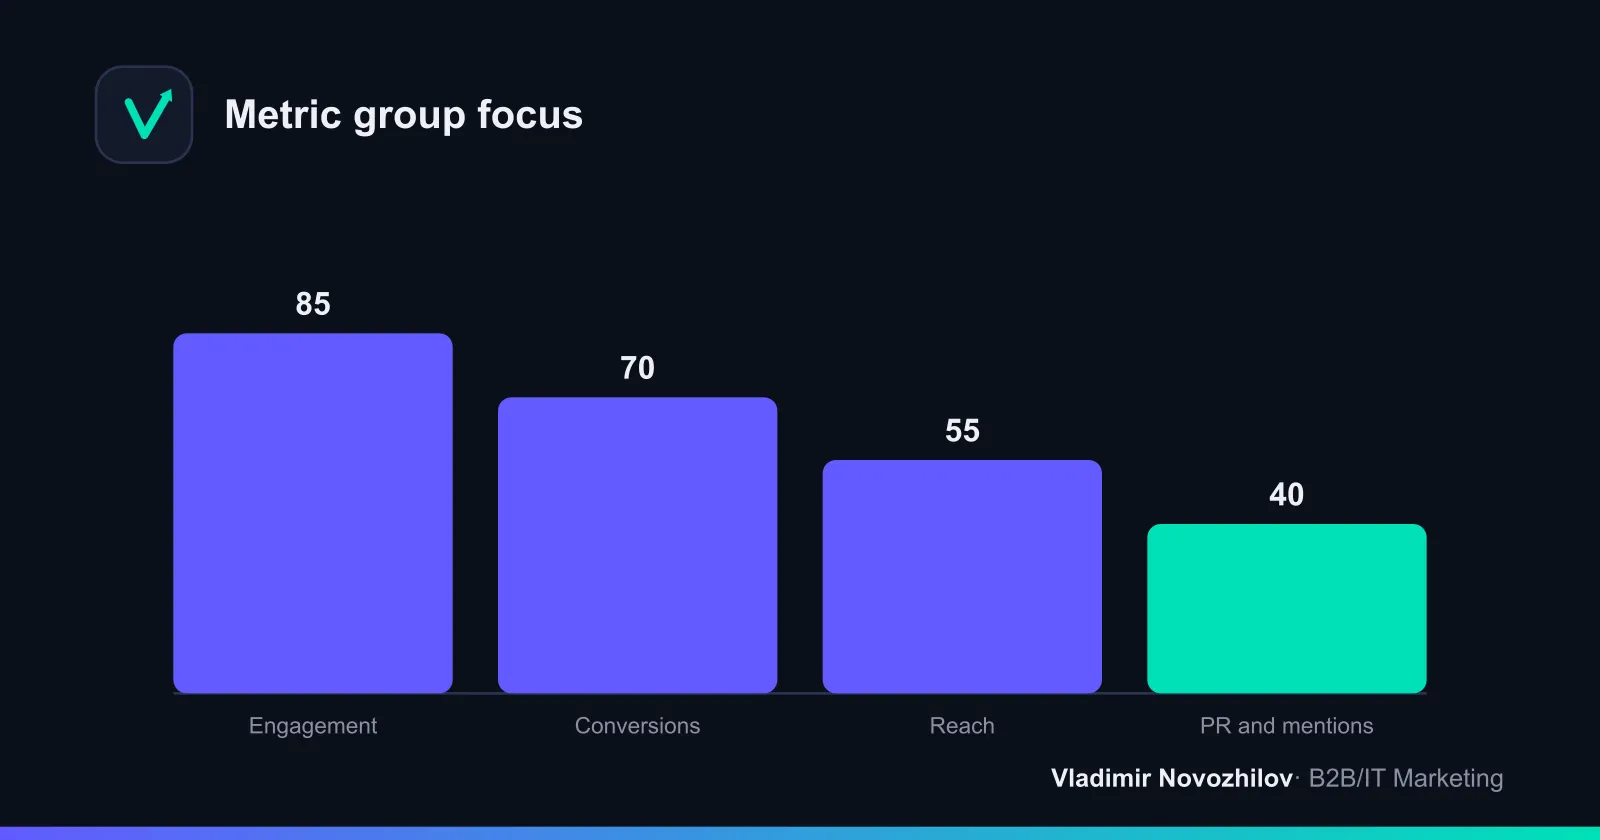
Example calculation. An article had 6,100 visitors, of which 2,200 scrolled to the end. Scroll to footer — 36%. Average time was 2 minutes 40 seconds versus expected 4 minutes. Conclusion: people arrive but don’t finish. Solution — shorten the introduction, add subheads and pull‑quotes, break up walls of text. After edits scroll rose to 51% and conversion to inquiry nearly doubled, because more readers reached the CTA block.
Mini‑FAQ for this section
What bounce rate is normal? For blog articles 60–75% is common, especially if the person came from search, read and left satisfied. It’s alarming when bounce approaches 90% with short time on page — the content doesn’t meet the query.
Visibility in AI search: how to check mentions in neural answers
A new and still underused group of indicators — visibility in AI search. Neural networks and features like AI Overviews increasingly answer users directly without sending them to the site. If your content is cited in those answers, you influence choice even without a click; if not — you lose part of the audience.
How to check mentions without a special budget:
- Collect 15–30 real questions from your audience — those your content answers.
- Ask them to neural networks and AI‑answering search. Record whether you appear in the answer, whether the brand is mentioned, whether a link is given, and if the wording is correct.
- Maintain a monitoring table with columns “query”, “mentioned (yes/no)”, “wording”, “date”. Recheck monthly.
- Watch referrals from AI services in Metrica and GA4 by traffic source — a growing but indirect signal.
AI Overviews — generative answers in search results. Their growth means some info queries are closed without a site visit, so it’s important to be present among sources for such answers.
To appear more often in neural answers use the same logic as for featured snippets: clear definitions, short self‑contained answers at the start of sections, lists, tables with formulas and explicit Q&A blocks. Models tend to quote such fragments more readily.
Mini‑FAQ for this section
Should I worry about traffic drop due to AI answers? Reframe evaluation. If you previously measured only clicks, add visibility in AI answers as a metric: a brand mentioned in a neural answer still works for awareness even when there’s no click.
Brand traffic and awareness growth
Brand traffic — visits and queries where users search by your name: “company N reviews”, “N prices”, “N blog”. Growth in brand traffic is one of the most honest indicators that content works for awareness.
The logic: a person read your article or saw you in the media, remembered you and later googled directly. The more such queries, the stronger your position in the audience’s mind.
How to measure:
- Yandex Wordstat — monthly dynamics of branded query frequency.
- Yandex.Metrica and GA4 — share of brand traffic among search referrals.
- Webmaster panels — impressions and clicks for queries containing the brand name.
Example. Before launching the blog and external publications branded queries were 900 per month. After six months of regular content — 2,400 per month. A 2.7× increase with unchanged ad budget — direct credit to content and PR.
Mini‑FAQ for this section
How to separate brand traffic from the total? In search query reports filter phrases containing the company name, product names and public employees’ names. Everything else is non‑brand traffic, which is also useful to monitor separately.
Conversion metrics: leads, inquiries, target actions
Conversion metrics show whether content delivers business actions. This is the transition from “interested” to “left contact.”
- Conversion to target action — share of readers who completed the desired action (subscription, inquiry, download, registration). Formula: target actions / visitors × 100%.
- Leads from content — number of inquiries originating from articles and placements.
- Cost per lead (CPL) — content costs / number of leads.
- Microconversions — intermediate actions: CTA click, newsletter signup, add to favorites. Especially important in B2B where the path to a deal is long.
Target action — any user action that brings them closer to a deal: inquiry, call, subscription, download. In analytics it’s set up as a goal.
Example calculation. A case article produced 3,100 visitors in a month, 47 downloaded a template (microconversion), 12 left an inquiry. Conversion to inquiry — 0.39% (12 / 3,100), to microconversion — 1.52%. For bottom‑funnel pieces in services 0.3–1% to inquiry is a workable range.
To tie an inquiry specifically to an article you need UTM tags on all links, configured goals in Metrica and GA4, and deal tagging in CRM by source. Without that conversions will hang on direct visits and organic without details.
Mini‑FAQ for this section
What if there are almost no conversions from content? Check whether the page has a clear next step. Often an excellent text ends with nothing — no form, CTA or link to related material. Add a call to action and a microconversion before discarding the article as ineffective.
Financial metrics: ROI, CAC, LTV, revenue from content
Financial indicators answer the main executive question: does content pay off. This is the language marketing uses with the business.
- Content marketing ROI = (revenue from content − costs) / costs × 100%. Shows return on every invested ruble.
- CAC (customer acquisition cost) = content costs / number of acquired customers. How much a customer from the channel costs.
- LTV — how much revenue a customer brings over the entire relationship. Comparing LTV and CAC shows whether the economics are healthy.
- Revenue from content — revenue from deals where content was a touch.
CAC — cost to acquire one customer. In content marketing it’s calculated from expenses on creating and promoting materials divided by number of customers from the channel.
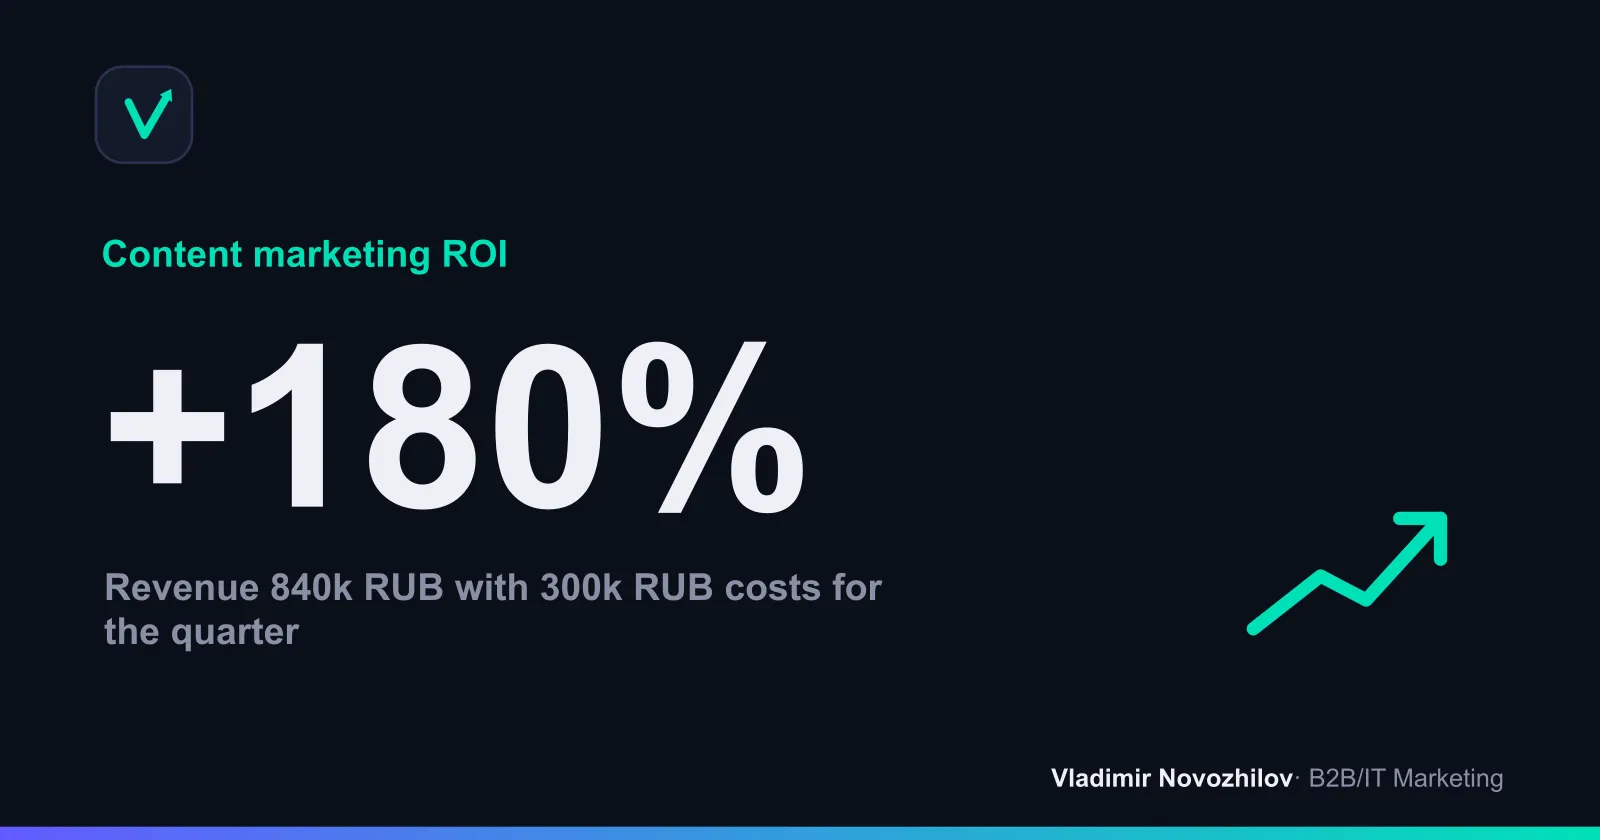
Step‑by‑step ROI calculation (instead of a calculator).
- Calculate quarterly costs: authors, editing, design, promotion — 300,000 rub.
- From CRM take deals with source “content/blog”: 6 deals.
- Average check — 140,000 rub. Revenue from content: 6 × 140,000 = 840,000 rub.
- ROI = (840,000 − 300,000) / 300,000 × 100% = 180%.
- CAC = 300,000 / 6 = 50,000 rub. per customer.
If end‑to‑end analytics are missing, revenue is estimated simply: leads with UTM × conversion to deal from CRM × average check. It’s approximate but enough to understand the order of magnitude. In B2B with long cycles calculate ROI over 2–4 quarters: costs are already spent while deals may not yet close — early estimates bias the picture negatively.
Mini‑FAQ for this section
ROI was negative in month two — should I shut down the channel? No. For content two months is ramp‑up. Look at traffic and lead dynamics: if they grow, revenue will follow. Negative ROI early is normal for cumulative channels.
PR metrics: number of publications, PR Points, MediaIndex, citation index
If you publish externally and in the media, add PR metrics to the usual indicators. They measure brand visibility in the media field.
- Number of publications and mentions — basic activity measure. Alone it says little about quality but matters in trend.
- PR Points — a scoring system for publications: each placement gets points for outlet reach, sentiment, presence of a link, speaker quote. Allows comparing different pieces on a single scale.
- MediaIndex — a visibility index in media, considering outlet reach, the company’s role in the piece and mention nature.
- Citation index — how often you’re quoted by other sites and linked to.
PR Points — a point method for media activity: publications receive points for outlet influence, sentiment and quality of mention, providing a unified comparison scale.
Example. In a quarter there were 14 publications: 4 in major industry media (5 points each), 6 in niche blogs (3 points each), 4 mentions without a link (1 point each). Total PR Points = 4×5 + 6×3 + 4×1 = 42 points. Next quarter — 58 points with the same number of publications: quality of outlets improved, not just quantity.
Tracking mentions is helped by media‑monitoring services and platforms for working with media (for example, Pressfeed to get journalist requests). You don’t need complex systems at start — manual brand name search suffices initially.
Mini‑FAQ for this section
Do I need PR metrics if we publish only in our blog? No. PR Points, MediaIndex and citation index apply to external placements. For your own blog measure reach, engagement, conversions and ROI.
Comparative table of metrics: what to measure at each stage
Below is a consolidated table of content‑marketing indicators with formulas, approximate norms and data sources. Competitors rarely have such a single table, and it answers “what and how to calculate” at a glance.
| Метрика | Этап воронки | Формула | Ориентир / норма | Где смотреть |
|---|---|---|---|---|
| Уникальные посетители | Охват | Счётчик уникальных визитов | Рост месяц к месяцу | Метрика, GA4 |
| Охват в соцсетях | Охват | Уникальные, увидевшие пост | Зависит от площадки | Статистика площадок |
| Процент отказов | Вовлечённость | Отказы / визиты × 100% | 60–75% для блога | Метрика, GA4 |
| Глубина просмотра | Вовлечённость | Страниц / визит | От 1,5 и выше | Метрика, GA4 |
| Доскролл | Вовлечённость | Дочитавшие / посетители × 100% | 40–60% до подвала | Карта скроллинга Метрики |
| Время на странице | Вовлечённость | Сумма времени / визиты | 3–5 мин на лонгрид | Метрика, GA4 |
| Конверсия в действие | Конверсии | Действия / посетители × 100% | 0,3–2% в заявку | Метрика, GA4, CRM |
| Стоимость лида (CPL) | Конверсии | Затраты / число лидов | Ниже, чем в платных каналах | CRM + затраты |
| Брендовый трафик | Узнаваемость | Доля брендовых запросов | Рост месяц к месяцу | Вордстат, вебмастер |
| ROI | Деньги | (Доход − затраты) / затраты × 100% | >100% на горизонте | CRM, сквозная аналитика |
| CAC | Деньги | Затраты / число клиентов | Ниже LTV в 3+ раза | CRM + затраты |
| PR Points | PR | Сумма баллов публикаций | Рост качества площадок | Медиамониторинг |
| МедиаИндекс | PR | Индекс заметности в СМИ | Рост в динамике | Сервисы мониторинга |
Tools for collecting and analyzing metrics
A separate comparative table of tools helps understand who does what and where to start.
| Инструмент | Что измеряет | Стоимость | Кому нужен |
|---|---|---|---|
| Яндекс Метрика | Охват, вовлечённость, доскролл, Вебвизор, цели | Бесплатно | Всем, база для рунета |
| Google Analytics 4 | Охват, события, конверсии, пути пользователя | Бесплатно | Всем, особенно с зарубежным трафиком |
| UTM-метки | Источник трафика и переходов | Бесплатно | Всем для атрибуции |
| CRM | Лиды, сделки, доход, источник | От платной | B2B и услугам с продажами |
| Сквозная аналитика | Связка расходов, лидов и денег | Платная | Зрелым проектам с несколькими каналами |
| Яндекс Вордстат | Динамика брендовых запросов | Бесплатно | Для оценки узнаваемости |
| Сервисы мониторинга упоминаний | Упоминания бренда в СМИ и сети | Платная | При активном внешнем PR |
| Pressfeed | Запросы журналистов, публикации | Freemium | Для работы со СМИ |
Minimum working free set: Metrica + GA4 + UTM tags + Wordstat. That’s enough to measure reach, engagement, conversions and brand traffic. CRM and end‑to‑end analytics are added when there’s a flow of leads and it’s necessary to count money. Media‑monitoring services — when external publications become numerous.
How to build a regular content‑marketing report
A report is needed not for looks but to make decisions: what to boost, what to rewrite, what to close. Below is a template checklist you can move to a spreadsheet and fill monthly.
Content‑marketing report checklist:
- Period and goal. Which month the report covers and what the content goal was.
- What was published. List of published materials and external placements.
- Reach. Unique visitors, views, social reach, month‑over‑month dynamics.
- Engagement. Average scroll, time on page, bounce rate, top‑3 and worst‑3 materials.
- Brand traffic. Dynamics of branded queries and its share.
- Visibility in AI search. How many queries from the monitoring list mention the brand.
- Conversions. Target actions, leads, conversion to inquiry, CPL.
- Money. Deals from content, revenue, ROI, CAC (if CRM data allow).
- PR metrics. Publications, PR Points, mentions (for external placements).
- Conclusions and decisions. What worked, what to rewrite, plan for next month.
Rule of a good report: every number has a comparison (to the previous period or the goal) and a conclusion. A number without context and decision is table clutter.
Common mistakes when evaluating content effectiveness
- Measuring everything. Thirty metrics create an illusion of control but obscure the main points. Choose 6–8 indicators tied to the goal.
- Evaluating content only by traffic. Traffic without engagement and conversions is a vanity metric. Many visits with zero inquiries is not success.
- Expecting ROI within a month. Content marketing is cumulative; early monetary evaluation usually gives a false negative.
- Ignoring attribution. Without UTM tags and deal tagging in CRM content’s merits dissolve into “direct visits.”
- Comparing the incomparable. You can’t judge an overview article by conversion, nor a case study by reach. Each piece has its own purpose.
- Forgetting about scroll and time. These metrics show exactly where readers drop off — without them you iterate blindly.
- Not accounting for long sales cycles. In B2B an inquiry often comes months after reading. Look at assisted conversions, not only last‑click.
In short about content‑marketing metrics
Content‑marketing metrics work only in combination and only against a specific goal. Start with the basics: reach — how many saw it, engagement — how they read it, conversions — how many reached out, money — did investments pay off. For external publications add PR Points, MediaIndex and citation index, and by 2026 — visibility in AI search. Assemble a free toolset (Metrica, GA4, UTM, Wordstat), set goals and deal tagging in CRM, keep a monthly report via the checklist — and content‑marketing effectiveness will stop being a black box.
FAQ on content‑marketing metrics
Which content indicators to track first? Traffic and unique visitors (reach), scroll depth and time on page (engagement), conversion to a target action and the number of leads (conversions). This set is enough to understand if content works and where to develop it.
How to measure content marketing if sales are offline? Use UTM tags, set up goals for intermediate actions (downloads, request a call), and record the source in CRM by asking “where did you hear about us?”. Also monitor brand traffic — its growth indirectly confirms content’s impact on offline sales.
How are content‑marketing KPIs different from ordinary metrics? A metric is any measurable indicator. KPIs are the metrics you choose as key for a concrete goal and by which you judge success. Content marketing KPIs are always tied to business tasks, not collected “for completeness.”
How to tell that content affects sales in B2B with a long cycle? Look at assisted conversions and first touch in user paths, not only the last click. Often the article opens the funnel and the deal closes months later via another channel — multi‑channel reports show this.
Lots of traffic but no inquiries — failure? Not necessarily. If the material is top‑level its job is reach and memorability. Check navigation, CTAs and the next step: does the content lead the reader further down the funnel.
Should I worry about organic decline due to AI answers? Shift your evaluation: add monitoring of brand mentions in generative summaries to reports — visibility in AI answers continues to work for awareness even when clicks don’t occur.
FAQ
- What should I track first to understand if content is working?
- Start with a basic set: traffic and unique visitors (reach), scroll depth and time on page (engagement), conversion to a target action and the number of leads (conversions). That’s enough to see the picture and growth points.
- How do I measure content impact if sales happen offline?
- Use UTM tags, track intermediate goals (downloads, request a call), and record the source in CRM based on the client’s answer. Also monitor brand traffic — its growth indirectly reflects content’s contribution to offline sales.
- How are content‑marketing KPIs different from ordinary metrics?
- A metric is any measurable indicator. A KPI is a metric chosen as key for a specific goal. In content marketing KPIs are always tied to a business objective, not collected just “for completeness”.
- How to prove content’s effect on sales in B2B with a long cycle?
- Look at assisted conversions and first touch in user paths, not only last‑click. Often an article opens the path while the deal closes later via another channel — multi‑channel sequences show that.
- Why is there lots of traffic but no inquiries — is that always a failure?
- Top‑funnel materials aim for reach and memorability. Check navigation, CTAs and the next step: does the content lead the reader further down the funnel. Don’t expect conversions from overview articles.
- What to do about organic decline caused by AI answers in search?
- Add visibility in generative answers as a metric: monitor brand mentions and presence of links. Brand recognition keeps growing even if there’s no click to the site.