Customer Journey Map (CJM): What It Is and How to Build One


TL;DR
A customer journey map (CJM) is a visual scheme of every stage a person goes through when interacting with a company, from recognizing a need to becoming a loyal customer. It shows touchpoints, emotions, and barriers, helping you spot where the business loses leads and money. This article covers a step-by-step guide to building one, a ready-made template table, a tool comparison, and real examples.
A customer journey map (CJM) is a visual scheme of every stage a person goes through when interacting with a company — from the moment they recognize a need to repeat purchases and referrals. It captures what the customer does, which touchpoints they pass through, what they think and feel along the way, and where they run into barriers. Simply put, a customer journey map shows your business through the customer’s eyes — not the way it looks from the sales department.
In this article, we’ll cover why businesses need a customer experience map, what it consists of, how to build a CJM step by step, provide a ready-made template table, compare tools, offer a self-check checklist, and share examples from different industries. The material is aimed at B2B, IT, and services, but the approach is universal.
What Is a Customer Journey Map (CJM)
A customer journey map is a tool that breaks the entire customer journey into stages and touchpoints, adding the person’s emotions, questions, and obstacles at each step. Unlike abstract discussions about a “target audience,” a CJM turns the customer experience into a concrete table or diagram that shows exactly where the interaction breaks down.
It’s important not to confuse two similar concepts. A sales funnel describes the path from the company’s perspective: number of leads, conversion between stages, cost of acquisition. A customer journey map describes the same path from the customer’s perspective: their actions, motives, and pain points. The funnel answers “how much are we losing,” the customer journey map answers “why are we losing it and what to do about it.”
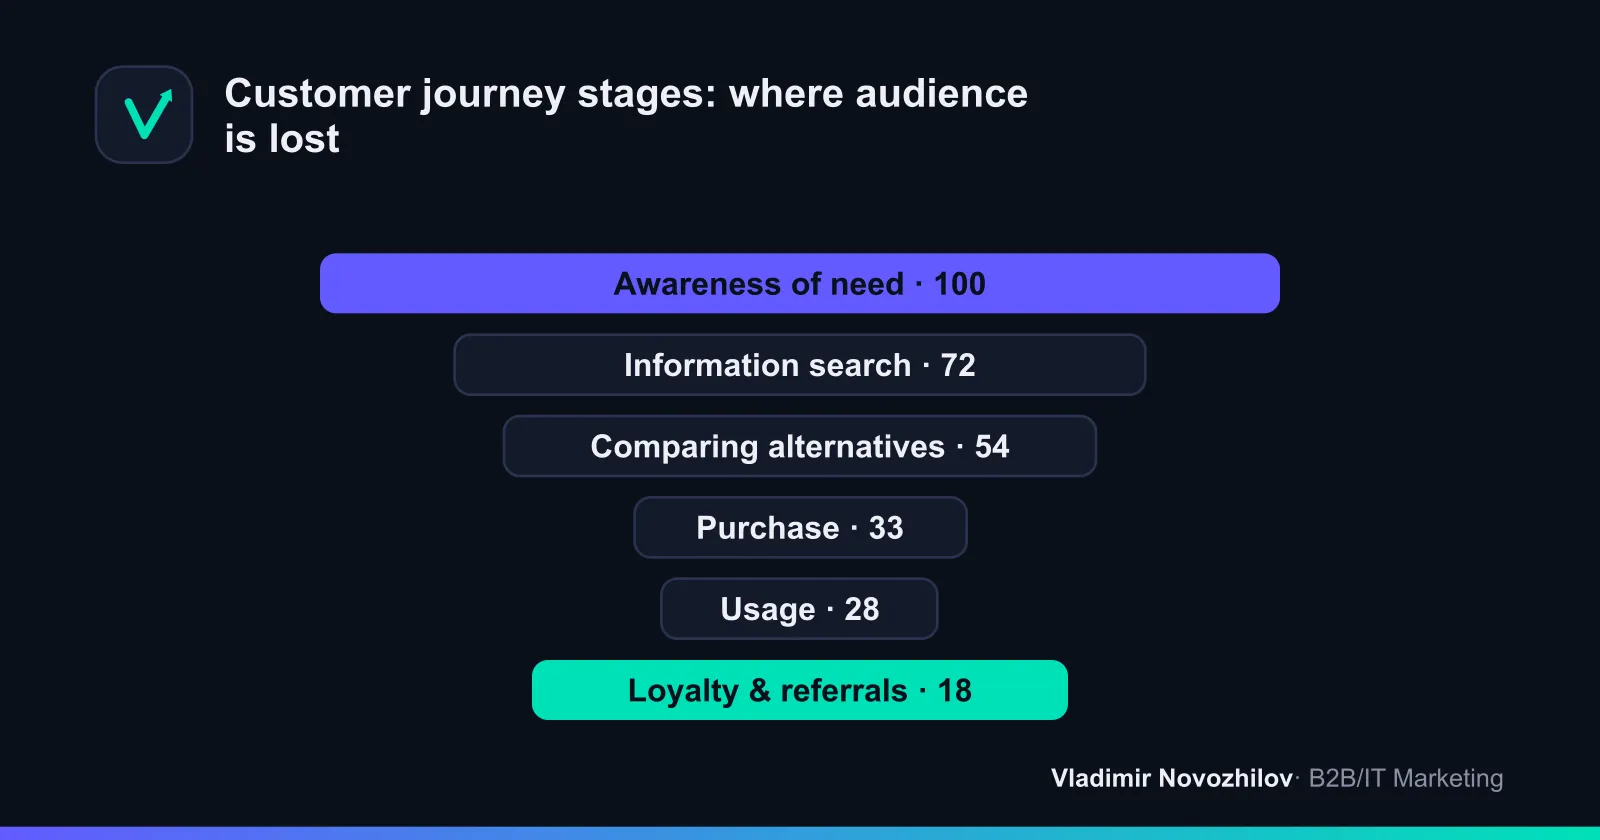
A CJM isn’t just a picture for a presentation — it’s a working document. A good customer journey map gives the team a shared language: marketing, sales, support, and product all look at the same journey and stop arguing about whose area of responsibility is “underperforming.”
Why Businesses Need a Customer Journey Map
The main value of a CJM is that it reveals the gaps between how a company thinks about its service and how the customer actually experiences it. Here’s what building a customer journey map delivers in practice:
- Identifies pain points. You see the exact moments where a person gets confused, waits too long, or doesn’t get an answer — and drops off.
- Boosts conversion. Removing barriers along the customer journey directly increases the transition between stages of the sales funnel.
- Reduces customer churn. The map reveals weak spots in product usage and support where frustration builds up.
- Aligns teams. A unified customer experience map removes the “seams” between departments where leads typically get lost.
- Saves budget. You invest in improvements that genuinely affect the purchase decision, rather than guessing.
According to industry customer experience research, the vast majority of buyers are willing to walk away from a company after a few bad interactions — even if they like the product. A map helps you catch these failures before the customer moves to a competitor.
What a CJM Consists Of: Key Elements
For a map to work, all its meaningful layers need to be filled in. The minimum set of customer journey map elements looks like this:
- Persona (buyer persona). A specific, composite image of a customer: role, goals, constraints. A map is always built for one persona.
- Customer journey stages. The major phases of interaction — from recognizing a need to loyalty.
- Customer actions. What the person actually does at each stage.
- Touchpoints. Channels and places where they interact with the company: website, ads, phone call, email, account manager, app.
- Customer emotions. What they feel — from joy to frustration. Usually plotted as an “emotional curve.”
- Barriers and pain points. What prevents them from moving forward: unclear pricing, slow responses, a complicated form.
- Opportunities and solutions. What the business can improve at this point.
- Metrics (KPIs). How to measure the state of the stage: conversion, NPS, CSAT, response time.
Touchpoints deserve special mention — they’re often underestimated. A single missed touchpoint — like not confirming receipt of a submitted form — can wipe out all the marketing effort that came before it.
Customer Journey Stages: From Recognizing a Need to Loyalty
The basic customer journey in B2B and services typically breaks down into six stages. The names may vary, but the underlying logic is the same.
- Awareness of need. The person realizes they have a problem or task to solve. Content, advertising, and reputation play a role here.
- Information search. The customer googles, asks colleagues, reads reviews. Key touchpoints are the website, articles, social media, and referrals.
- Comparing alternatives. Evaluating options by price, features, and trust. Case studies, reviews, and clear positioning matter most.
- Purchase. Closing the deal, signing the contract, paying. Simplicity and speed are critical here: a complicated form or a slow account manager kills conversion.
- Usage (consumption). The customer uses the product or service. Onboarding, support, and quality do the work.
- Loyalty and referrals. Repeat purchases, reviews, word of mouth. This affects LTV and lowers the cost of acquiring new customers.
In B2B, the stages are longer and more complex: approvals, multiple decision-makers, and tenders come into play. That’s why a customer journey map for a corporate buyer is almost always more detailed than one for a retail customer.
How to Build a Customer Journey Map: Step-by-Step Guide
Below is a working five-step algorithm for how to build a CJM on your own. It works both for your first map and for regular updates.
Step 1. Define Goals and KPIs
First, answer why you need the map. “We want to improve customer experience” is too vague. Set a specific goal: reduce churn at the onboarding stage, increase conversion from lead to contract, cut support response time.
Define right away the metrics you’ll use to measure results:
- conversion between sales funnel stages;
- NPS (likelihood to recommend) and CSAT (satisfaction);
- LTV and customer churn rate;
- response and resolution time.
Bring in stakeholders — representatives from sales, support, marketing, and product. They’ll provide different data perspectives and help implement changes later.
Step 2. Gather Customer Data and Create Personas
A map based on guesswork is useless. Rely on data:
- Qualitative: customer interviews, conversations with sales and support staff, call recordings, reviews.
- Quantitative: web analytics, CRM data, conversion rates, drop-off reports.
Based on this, create buyer personas — 1–3 composite portraits with goals, fears, selection criteria, and typical objections. Build a separate map for each key persona: the journey of a newcomer differs from that of an experienced customer, just as the journey of a small business differs from that of a corporation.
Step 3. Define Stages and Touchpoints
Break the customer journey into stages (see the section above), and under each one, list all the touchpoints. Follow the customer’s actual experience, not your org chart.
A useful exercise: walk the customer journey yourself. Submit a request on your own website, call your own sales department, try placing an order. You’ll be surprised how many touchpoints don’t work the way you assumed.
Step 4. Assess Customer Emotions and Barriers
For each touchpoint, record:
- what the customer does;
- what question or expectation they have;
- what emotions they experience (plot an emotional curve);
- what barrier prevents them from moving forward;
- what opportunity for improvement exists here.
Barriers and dips in the emotional curve are exactly where your growth opportunities lie. Wherever the customer gets frustrated or hesitant, you’re losing money.
Step 5. Visualize and Implement the Map
Bring everything together into a single map — a table or diagram. Visualization matters because it helps teams see and accept the map. But the picture itself isn’t the point — the point is an action plan: a specific list of improvements with owners and deadlines.
After implementation, revisit the metrics from Step 1 and compare before and after. A customer journey map is a cyclical tool: fix a barrier, measure the effect, find the next one.
Types of Customer Journey Maps: Current and Future State
There are several formats of customer experience maps for different purposes:
- Current state (as is). Describes how the customer journey looks right now, with all its problems. This is the basic and most common type — start here.
- Future state (to be). Shows the ideal journey you’re aiming for after making improvements. Used for planning changes.
- Day in the life. Captures the customer’s routine and context more broadly than just their interaction with you. Helps uncover new needs.
- Service blueprint. Complements the map with the company’s internal processes — what happens “behind the scenes” at each touchpoint.
The best combination for getting started: a current-state map to see the problems, and a future-state map to set the target.
CJM Template: A Ready-Made Table for Building Your Map
Here’s a CJM template in table format that you can copy into Google Sheets or Excel. Rows are the meaningful layers, columns are the journey stages. Fill it out separately for each persona.
| Layer / Stage | Awareness | Information Search | Comparison | Purchase | Usage | Loyalty |
|---|---|---|---|---|---|---|
| Customer goal | Understand the problem | Find solutions | Choose the best option | Close the deal | Get results | Repeat, recommend |
| Actions | Searches for the cause of the pain | Reads articles, reviews | Compares 2–3 options | Fills out a form, pays | Uses the product | Leaves a review |
| Touchpoints | Ads, social media | Website, blog, search | Case studies, account manager | Form, contract, payment | Onboarding, support | Newsletter, NPS survey |
| Emotions | Anxiety | Curiosity | Doubt | Tension | Anticipation/joy | Trust |
| Barriers | Doesn’t recognize the problem | Little accessible content | Unclear pricing | Complicated form | Slow start | No reason to return |
| Opportunities | Useful content | Transparent materials | Calculator, case studies | Simplify the process | Fast onboarding | Loyalty program |
| KPI | Reach, CTR | Time on site | Conversion to lead | Conversion to payment | CSAT, churn | NPS, LTV |
This template covers the “stages × actions × touchpoints × emotions × barriers” framework, which is rarely provided ready-made. Adapt the rows to your specifics — for example, in B2B, add a row for “decision-makers.”
Tools for Building a CJM: Overview and Comparison
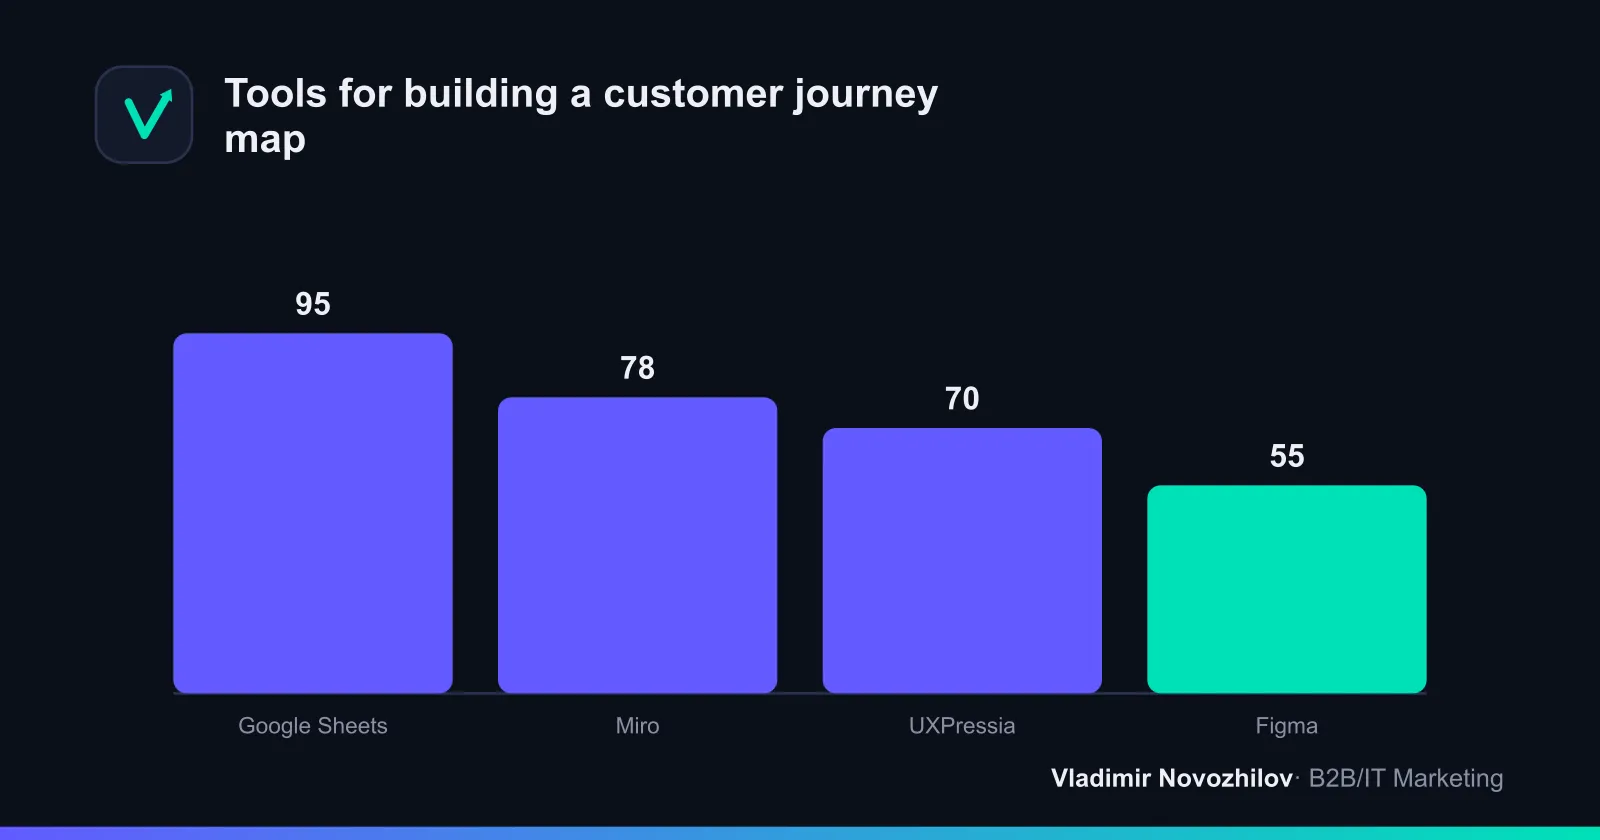
The choice of tool depends on your budget, team size, and how often you work with maps. Below is a comparison of popular options.
| Tool | Starting cost | Learning curve | Collaboration | Best for |
|---|---|---|---|---|
| Google Sheets | Free | Very low | Yes | First map, small business |
| Miro | Free tier + paid | Low | Excellent | Workshops, team sessions |
| Figma | Free tier + paid | Medium | Good | Design teams, polished diagrams |
| UXPressia | Freemium + paid | Medium | Good | Many maps, ready-made CJM and persona templates |
Practical advice: don’t pick a tool before you understand the methodology. For your first customer journey map, Google Sheets and the template above are enough. It makes sense to move to Miro or UXPressia once you have many maps and need team collaboration.
Common Mistakes When Building a CJM
Most maps fail not because of the tool, but because of mistakes in the approach:
- Guesswork map. Built on the team’s opinions rather than data and customer interviews. The result is a beautiful but false picture.
- Inside-out perspective. Stages described according to the org chart rather than the customer’s experience. Then the map just mirrors your funnel, not the person’s journey.
- One persona for everyone. Trying to describe different segments with a single map blurs the conclusions.
- No emotions or barriers. The map turns into a list of channels without answering “why does the customer leave.”
- A map for its own sake. A beautiful diagram without an action plan and owners remains just a presentation.
- A one-time document. The map gets drawn once and forgotten. Customer experience changes — the map needs to be updated.
Customer Journey Map Readiness Checklist
Go through this list before considering your map finished:
- The map is built for a specific customer persona.
- Real data was used: interviews, CRM, analytics.
- All customer journey stages are described — from awareness to loyalty.
- Touchpoints are listed under each stage.
- Customer actions, emotions, and barriers are filled in.
- An emotional curve is drawn, showing the dips.
- Each stage is tied to metrics (conversion, NPS, CSAT).
- There’s a list of improvements with owners and deadlines.
- A date is set for the next review of the map.
If even one item isn’t checked off, the map is still a draft.
Customer Journey Map Examples from Different Industries
Let’s look at two short CJM examples to see the logic in action.
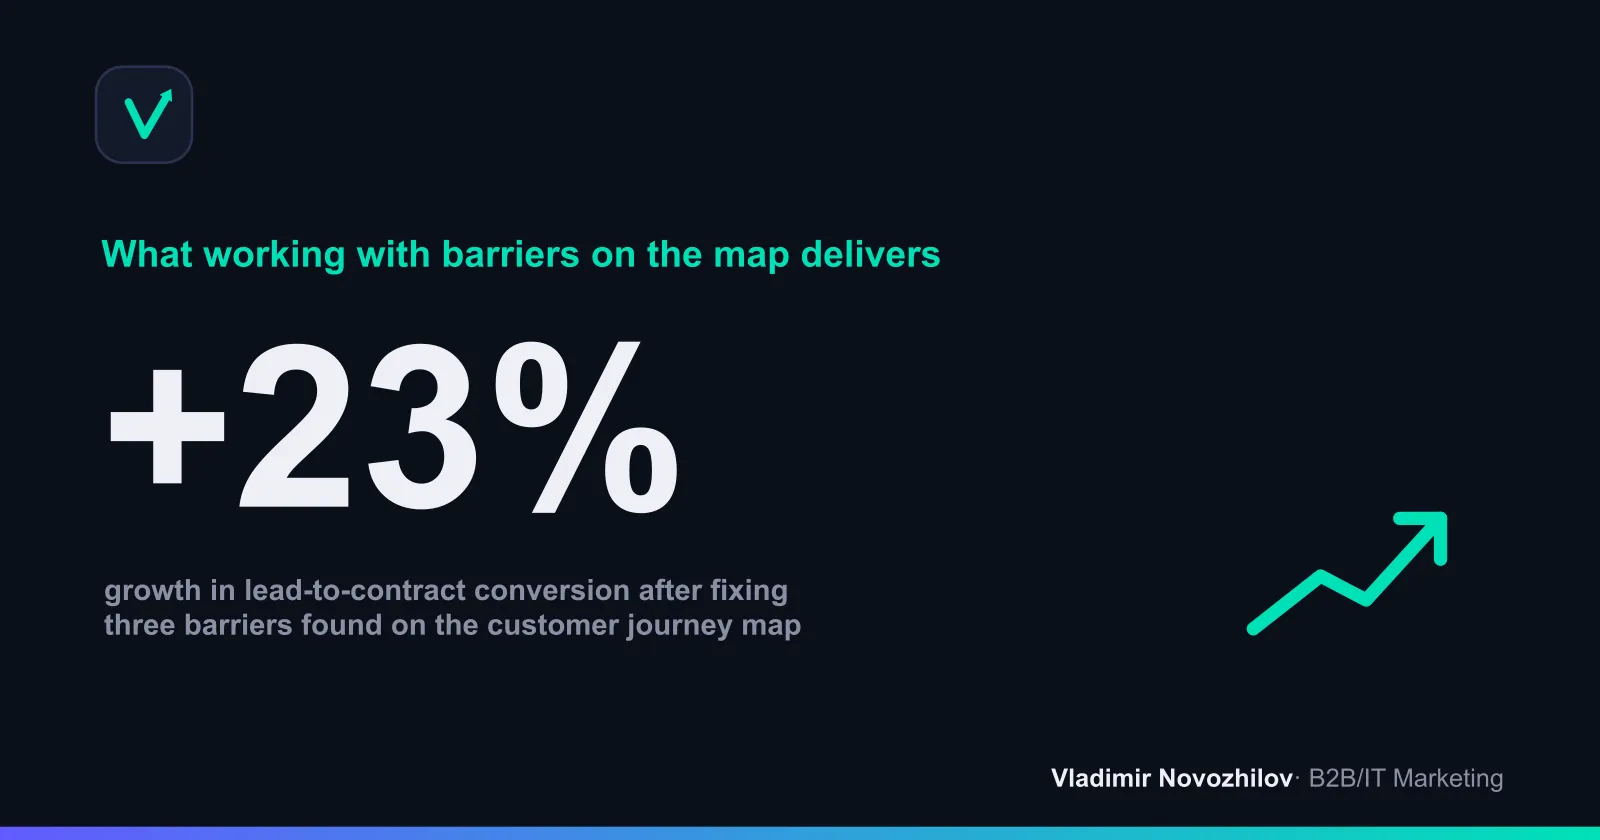
Example 1. B2B services (current state). A service company noticed low conversion from lead to contract. Building a customer journey map revealed three barriers: at the comparison stage, customers didn’t understand pricing (no calculator on the website); at the purchase stage, the form required unnecessary information; and account managers took an average of a day to respond. After fixing these points — adding a calculator, shortening the form, and setting a 2-hour response standard — conversion grew by 23% in one quarter (see the figure above).
Example 2. IT product (future state). A company with high onboarding churn built a future-state map. In the ideal journey, the customer goes through a short welcome scenario, gets their first value on day one, and receives timely tips. The map set the plan: step-by-step onboarding, helpful email tips, proactive support. This reduced early churn and increased LTV.
The common takeaway from both examples: value doesn’t come from the customer experience map itself, but from the actions it leads to.
Key Takeaways: Customer Journey Map in Brief
A customer journey map (CJM) is a way to see your business through the customer’s eyes and find exactly where leads, money, and loyalty are being lost. Start with one persona and one goal, gather real data, break the journey into stages and touchpoints, capture emotions and barriers, and turn your findings into an improvement plan. Use the ready-made template table, check your map against the checklist, and update it at least once a year. Even a simple map in Google Sheets, built on data rather than guesswork, pays for itself through higher conversion and lower churn.
FAQ
- How is a CJM different from a sales funnel?
- A sales funnel shows the customer's movement from the business's point of view and its metrics: how many people move from one stage to the next and what the conversion rate is. A customer journey map looks at the same path through the customer's eyes: what they do, think, and feel at each touchpoint, and where they get frustrated and leave. The funnel answers 'how much are we losing,' the CJM answers 'why are we losing it.' They work well together.
- How long does it take to build your first customer journey map?
- A team of 2–4 people can put together a draft map for one segment in 1–2 working days if customer data is already available. A full-fledged customer journey map with interviews, analytics, and hypothesis testing takes 2–4 weeks. Don't aim for perfection right away: a quick version based on real data that you refine over time is better than months of approvals.
- Which tool should a beginner choose for CJM — Google Sheets, Miro, or UXPressia?
- Start with Google Sheets: they're free, easy to understand, and let you map out stages, touchpoints, emotions, and barriers without any learning curve. Miro is convenient for collaborative workshops and visual diagrams. UXPressia is a specialized service with ready-made CJM templates and personas — useful once you have many maps to manage. For your first map, a spreadsheet is enough.
- Do you need a separate CJM for each customer segment?
- Yes, if the segments behave differently. The journey of a corporate client going through a tender process and the journey of a small business making a quick purchase decision are radically different — they can't be captured in one map. Build a separate customer journey map for each key persona. If the scenarios are nearly identical, one map with notes on the differences is enough.
- How often should a customer journey map be updated?
- Review the map at least once every 6–12 months, as well as after launching a new product, redesigning your website, changing channels, or adjusting pricing. A CJM is a living document, not a one-time presentation. Tie updates to regular metric reviews (NPS, CSAT, conversion, churn) — if the numbers drop, the map is the first place to look for the cause.
- How do you measure the effectiveness of implementing a CJM?
- Set KPIs for each stage in advance: conversion between funnel steps, NPS and CSAT at key touchpoints, response speed, repeat purchase rate, LTV, and customer churn. Compare these metrics before and after fixing the barriers identified on the map. Higher conversion and satisfaction combined with lower churn is the direct effect of working with a customer journey map.