Lead Generation Metrics: What to Track for Growth

TL;DR
Lead generation metrics fall into three tiers: marketing (CPM, CPC, CTR), funnel (CPL, lead conversion, MQL/SQL), and business metrics (CAC, LTV, LTV/CAC, ROMI). To avoid burning budget, look at the whole chain — lead cost, lead quality, payback — not a single number. This article covers formulas, channel benchmarks, a reporting template, and a checklist.
If you’re spending budget on customer acquisition but don’t know which channels bring in money and which just generate check-the-box submissions, your lead generation metrics aren’t properly set up. Lead generation metrics are a set of quantitative and qualitative indicators that show how much a single lead costs, how good it is, and whether the acquisition ultimately pays off. In this article, I’ve put together a practical list of lead generation KPIs with formulas, channel and B2B/B2C benchmarks, a reporting template, and a starter checklist.
What Lead Generation Metrics Are and Why They Matter
Lead generation metrics are measurable indicators describing the path from first touch to closed deal: reach, cost per lead, lead conversion rate, lead quality, and return on investment. Without them, marketing turns into spending blind: leads seem to be flowing in, but profit isn’t growing.
The real value of lead generation metrics lies in the connections between them. A single number almost always misleads. A cheap lead might turn out to be junk; an expensive one might land a major contract. That’s why you need to look at the whole chain: lead cost → lead quality → final revenue.
Three Tiers of Metrics: Marketing, Funnel, Business
It’s useful to organize all lead generation KPIs into three tiers — this makes it easier to stay organized and assign ownership.
- Marketing metrics — top of funnel: impressions, reach, CPM, CPC, CTR, engagement rate. Answer the question ‘how well are ads and creatives performing.’
- Funnel metrics — middle of funnel: site-to-lead conversion, CPL, lead conversion rate, MQL and SQL, response rate, funnel velocity. Answer the question ‘how well do submissions turn into purchase-ready prospects.’
- Business metrics — bottom of funnel and outcomes: CAC, LTV, LTV/CAC, payback period, ROMI, ROAS, retention rate, NRR. Answer the question ‘are we actually making money.’
Key Lead Generation Performance Indicators (KPIs)
Below is a baseline set worth tracking in almost any business. The formulas are simple, but they’re often confused.
| Metric | Formula | What It Shows |
|---|---|---|
| CPM | spend ÷ impressions × 1,000 | cost per thousand impressions |
| CPC | spend ÷ clicks | cost per click |
| CTR | clicks ÷ impressions × 100% | ad click-through rate |
| Lead conversion rate | leads ÷ visits × 100% | site/landing page effectiveness |
| CPL | spend ÷ leads | cost per lead |
| MQL→SQL | SQL ÷ MQL × 100% | qualification quality |
| CAC | total acquisition spend ÷ customers | cost per customer |
| LTV/CAC | LTV ÷ CAC | acquisition payback |
Lead Volume Metrics: Reach, CPL, Lead Conversion Rate
Quantitative lead generation metrics measure volume. Start here, but never stop here.
Total leads and leads by channel. Track these separately by source — otherwise you won’t know what to scale.
Lead conversion rate = leads ÷ visits × 100%. For a landing page, 2–8% is often considered normal; for cold traffic, expect less. Example: 4,000 visits and 160 submissions give a 4% conversion rate.
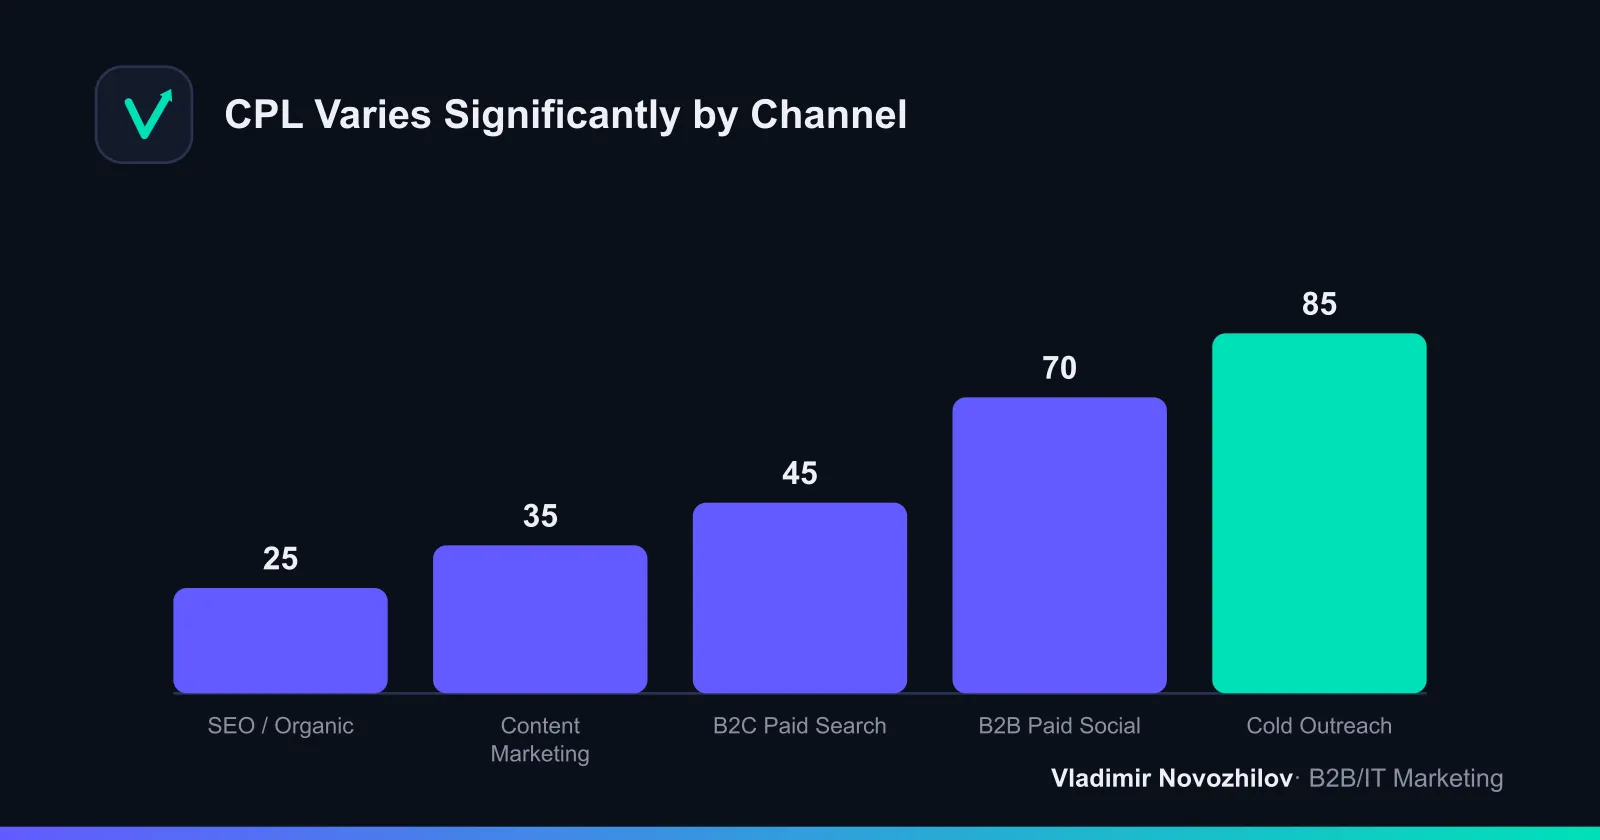
CPL (cost per lead) = ad spend ÷ number of leads. This is one of the most widely cited metrics, but it can’t be judged in isolation from quality: a low CPL paired with a low SQL share is a trap.
Lead Quality Metrics: MQL, SQL, Lead Scoring
Lead quality is what separates revenue from the illusion of activity. Three tools matter here.
MQL and SQL. An MQL is a lead that fits formal criteria and has shown interest. An SQL is a lead that sales has confirmed as ready for a conversation. Track both conversions: MQL→SQL and SQL→customer.
Lead scoring is a point-based evaluation of a lead based on attributes (job title, industry, company size, on-site behavior). It helps sales prioritize the hottest prospects first.
Lead response time. The faster a rep reaches out, the higher the conversion. Responding within 5 minutes is many times more effective than responding a day later.
The Lead Generation Funnel and Its Stages
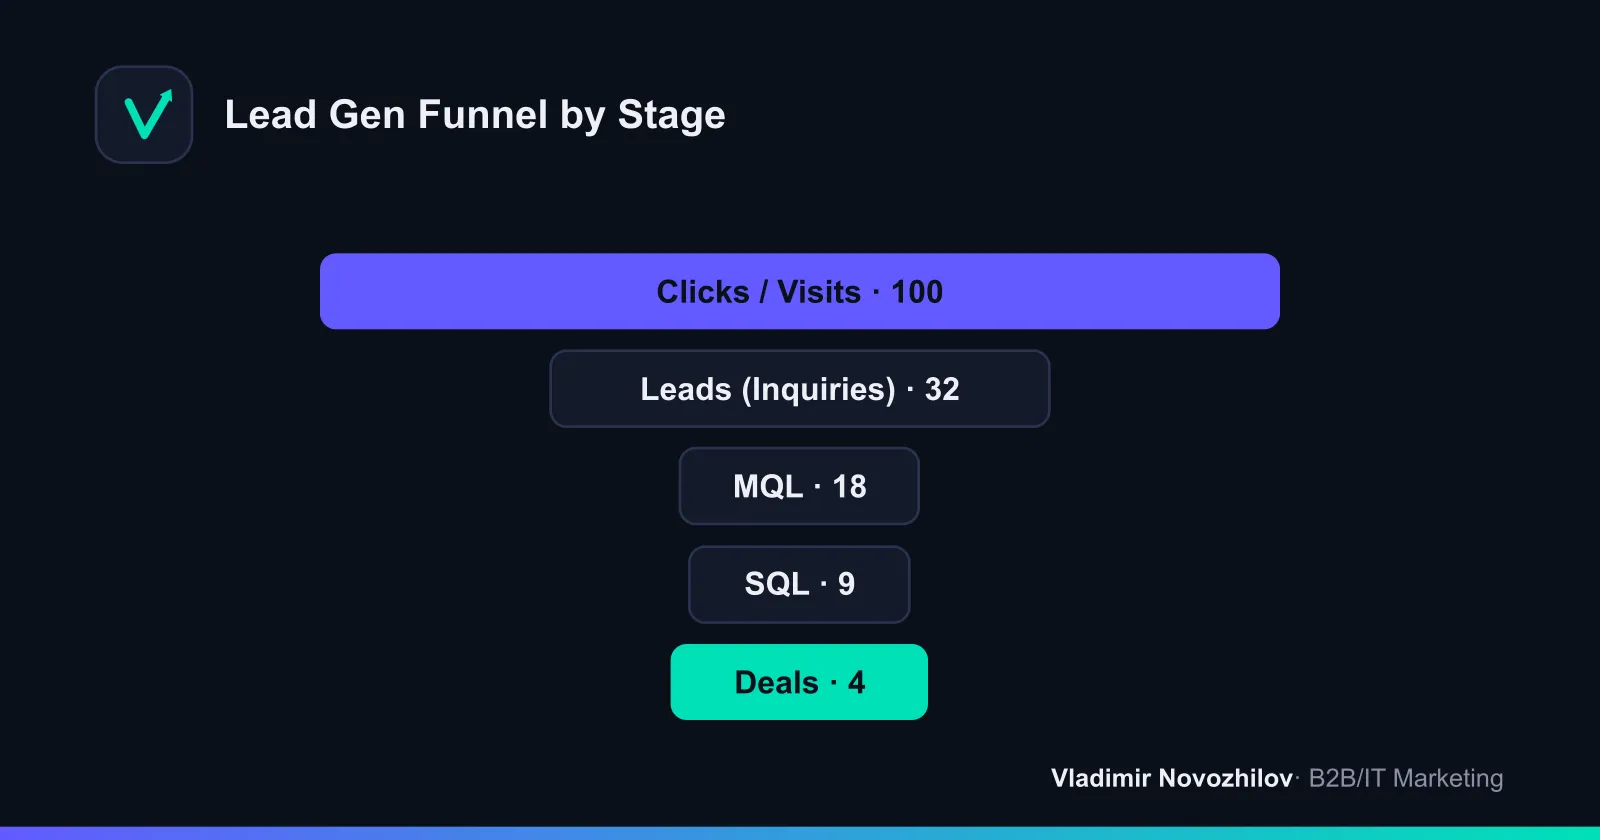
The lead generation funnel is a sequence of stages from touch to deal: visit → submission (lead) → MQL → SQL → deal. At each transition, some contacts drop off, and the conversion percentages between stages show exactly where the leak is.
Separately track funnel velocity and time to convert — how many days it takes a lead to become a deal. In B2B this is critical: a long cycle distorts any monthly report unless you tie leads back to cohorts.
CAC, LTV, and LTV/CAC — Business Metrics of Payback
Business metrics translate leads into money.
- CAC = total marketing and sales spend ÷ number of new customers.
- LTV = average order value × purchase frequency × customer lifespan (or calculated via margin).
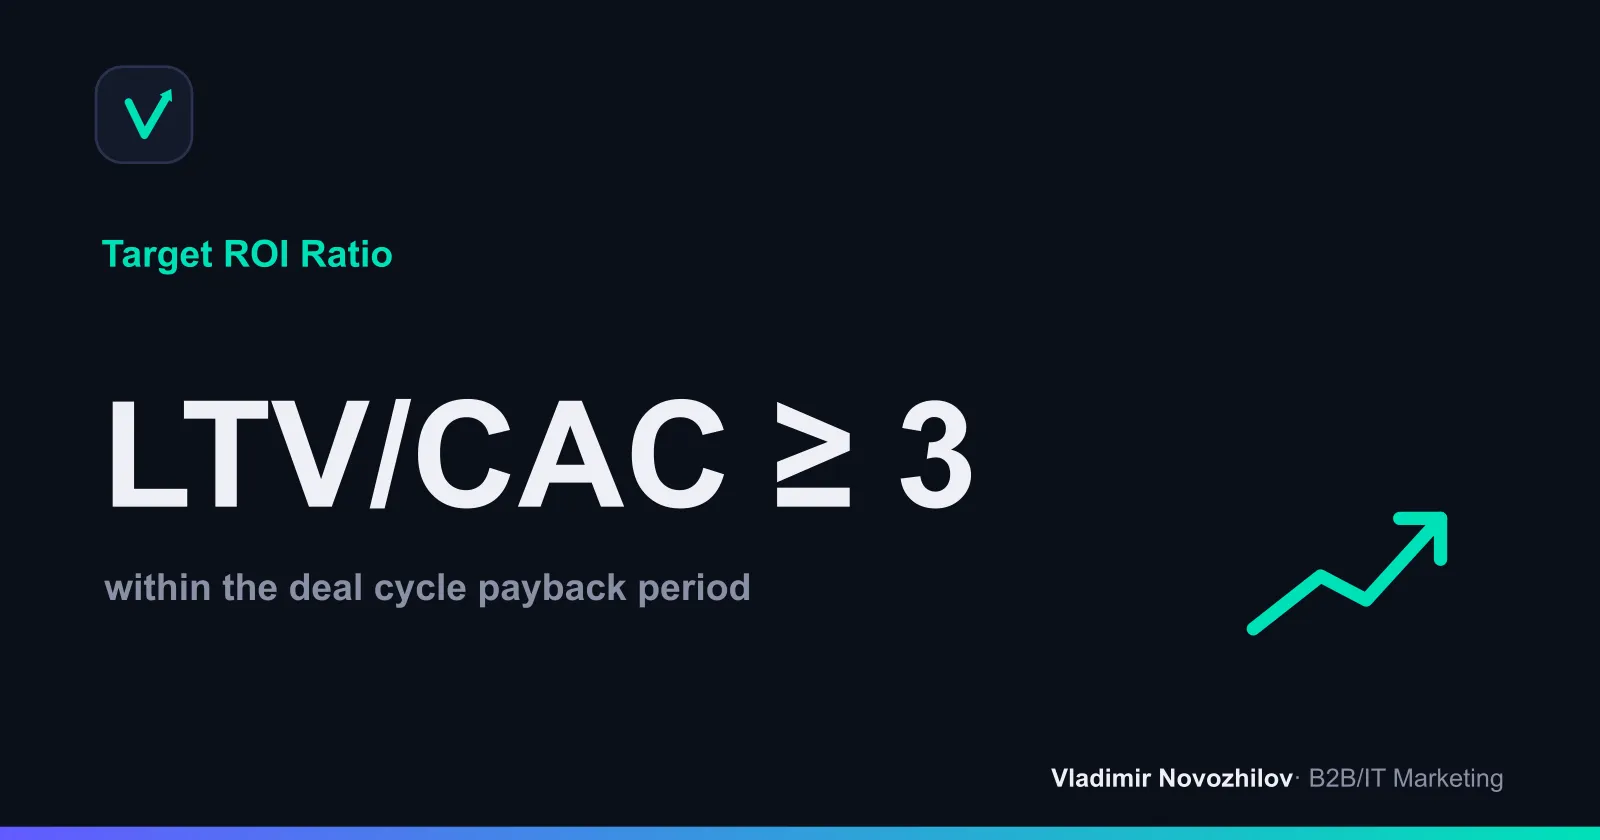
- LTV/CAC — the key health indicator: target ≥ 3.
- Payback period — how long it takes to recoup customer acquisition cost.
- ROMI/ROAS — return on marketing investment and on ad spend.
For deeper evaluation, use cohort analysis of leads: group leads by acquisition month and track how they convert and pay off over time. This saves you from the illusion of ‘averages.‘
Channel and B2B/B2C Benchmarks
There are no universally ‘correct’ numbers, but benchmarks help you spot anomalies. The table below shows averaged ranges — calibrate them to your own market.
| Channel | CTR | CPL (B2C) | CPL (B2B) | Notes |
|---|---|---|---|---|
| Paid search | 2–6% | 300–1,500 ₽ | 2,000–8,000 ₽ | fast, but grows pricier over time |
| Social media ads | 0.8–2% | 200–1,200 ₽ | 2,500–9,000 ₽ | requires a strong offer |
| SEO / organic | — | 100–800 ₽ | 800–4,000 ₽ | gets cheaper over time |
| Content marketing | — | 150–900 ₽ | 1,000–5,000 ₽ | slow to ramp up |
| Cold outreach | — | — | 3,000–12,000 ₽ | high CPL, but targeted |
B2C channels deliver cheap leads at volume; B2B channels are expensive but come with higher LTV. That’s why in B2B, LTV/CAC matters more than CPL.
How to Build a Lead Report: Frequency, Dashboard, Who Needs What
A lead report should answer a specific person’s question, not ‘show everything at once.’ Split metrics by role and cadence.
| Role | Metrics | Frequency |
|---|---|---|
| Executive | CAC, LTV/CAC, ROMI, payback, revenue by source | monthly |
| Marketing | CPL, CTR, lead conversion rate, MQL share by channel | weekly |
| Sales | SQL count, response time, SQL→deal conversion | daily/weekly |
Lead report structure template (use as a section checklist):
- Period and goals for the period.
- Total leads and leads by channel (trend vs. prior period).
- CPL by channel and average CPL.
- Lead conversion rate by landing page.
- MQL, SQL, and both conversion rates between them.
- Lead response time and funnel velocity.
- CAC, LTV/CAC, ROMI by source.
- Conclusions and 3 actions for the next period.
Tools for Collecting and Analyzing Lead Generation Metrics
- Web analytics — visits, site-to-lead conversion, behavior.
- Ad platforms — CPM, CPC, CTR, spend.
- CRM — lead movement through the funnel, MQL/SQL, deals.
- Closed-loop analytics — connects clicks, leads, and revenue into one picture; without it, CAC and ROMI are calculated blind.
- BI dashboard — brings everything together on one screen, segmented by role.
Common Mistakes When Working with Lead Generation Metrics
- One metric instead of a chain. A low CPL with junk leads isn’t a win.
- The last-touch trap. Giving all the credit to the last source undervalues the top of the funnel.
- Averages hide problems. A decent average CPL can mask a failing channel.
- Ignoring sales cycle length. In B2B, a lead from March may close in June — monthly reporting lies.
- Unqualified leads. Counting submissions instead of purchase-ready prospects.
- Metrics for show. Pretty numbers instead of honest revenue.
Mini Case Study: Before and After Optimization
A service company was paying 1,500 rubles per lead and was happy with the volume. After introducing qualification and lead scoring, it turned out only 20% of leads reached SQL status. They dropped two weak channels, strengthened content, and cut response time from 6 hours to 15 minutes. A quarter later: CPL rose to 1,800 rubles, but the SQL share climbed to 41%, and CAC dropped by 27% — because sales stopped wasting time on unqualified inquiries.
Lead Generation Metrics Checklist to Get Started
- Set up lead tracking by channel in your CRM.
- Calculate CPL and lead conversion rate separately by source.
- Define MQL and SQL criteria and measure both conversion rates.
- Implement lead scoring and monitor response time.
- Connect leads to revenue through closed-loop analytics.
- Calculate CAC, LTV, and LTV/CAC (target ≥ 3).
- Build a dashboard segmented by role.
- Run a cohort analysis of leads monthly.
- Check your data against the six common mistakes above.
Once you close out these nine items, your lead report stops being a pile of disconnected numbers and becomes a real tool for managing sales growth.
FAQ
- Which lead generation metrics matter most for B2B versus B2C?
- For B2B, the key metrics are lead conversion rate, MQL and SQL share, funnel velocity, and CAC and LTV/CAC, because the sales cycle is long and lead volume is low. For B2C, CPL, CTR, site-to-lead conversion, and ROMI take priority, since lead volume is high and unit cost drives results. In both cases, don't rely on a single number — connect lead cost to lead quality and to final revenue.
- How do you calculate CPL, and what's the benchmark across niches?
- CPL (cost per lead) = ad spend ÷ number of leads. For example, 120,000 rubles ÷ 80 leads = 1,500 rubles per lead. The benchmark depends heavily on channel and market: in B2C paid search it's often 300–1,500 rubles, while the same channels in B2B run 2,000–8,000 rubles or more. Don't chase a 'market average' — judge CPL against your own unit economics: it's acceptable if customer LTV multiplies CAC many times over.
- What's the difference between MQL and SQL, and how are they counted?
- An MQL (Marketing Qualified Lead) has shown interest and fits formal criteria (job title, industry, budget) but isn't ready for a deal yet. An SQL (Sales Qualified Lead) is confirmed by the sales team as ready to discuss a purchase. Track two conversion rates: MQL→SQL and SQL→customer. If you have plenty of MQLs but few SQLs, the problem lies in lead quality or qualification criteria.
- How do you build a lead report for executives versus the sales team?
- Executives need business metrics — CAC, LTV/CAC, ROMI, payback period, and revenue by source — reviewed monthly. Sales needs operational numbers: SQL count, lead response time, and SQL-to-deal conversion, tracked weekly or daily. Marketing needs CPL, CTR, lead conversion, and MQL share by channel. A single dashboard segmented by role solves this.
- How do you connect lead generation metrics to revenue and LTV?
- Set up closed-loop analytics: link the ad click, the lead in your CRM, and the closed deal through a single identifier (UTM + deal). Then you'll see not just CPL, but customer acquisition cost (CAC), which you can compare against LTV. A healthy ratio is LTV/CAC of 3 or higher, with a payback period within the length of your sales cycle.
- What are the most common mistakes when analyzing lead generation metrics?
- The biggest mistakes: looking at one metric in isolation, crediting all value to the last touchpoint, relying on averages that hide failing segments, evaluating leads without qualification or without accounting for sales cycle length. Another common trap is optimizing for a nice-looking report instead of real revenue — counting submissions instead of dollars.