Content Marketing Metrics: What to Track and How to Calculate


TL;DR
Content marketing metrics fall into four groups: reach (views, visitors, impressions), engagement (scroll depth, time on site), conversions (leads, target actions), and money (ROI, CAC, LTV, revenue). Plus PR metrics for external publications — PR Points, Media Index, citation index. Choose metrics based on the content's goal and funnel stage, not by tracking everything at once.
Content marketing metrics are indicators that answer one question: is your content working for the business? They’re conveniently grouped into four categories: reach (how many people saw the material), engagement (do they read through and watch to the end), conversions (does the content generate leads), and money (does the investment pay off). PR metrics for external publications — PR Points, Media Index, and citation index — stand apart. Below is how to choose metrics for your goal, which formulas to use, what benchmarks are reasonable, and which tools to use to collect it all.
One caveat up front: you don’t need to track everything at once. Most teams in B2B, IT, and services have enough resources for 6–8 key metrics. The task is to choose the ones tied to your current goal and review them regularly, rather than building a pretty but useless table of thirty numbers.
Why content marketing is hard to measure with standard metrics
The main difficulty is that content doesn’t influence a decision directly or instantly. A person might read your article on Monday, come back a month later via a branded search, and submit an inquiry through an ad. Formally, the lead “came from paid search,” even though the article delivered the first and decisive touch. This is the attribution problem, and it’s the reason content is often undervalued.
The second reason is the delayed effect. Unlike performance channels, where money spent produces leads the same day, content marketing is cumulative. Organic search traffic typically builds up over 3–6 months, and full ROI in niches with a long sales cycle becomes visible after six months to a year.
The third reason is that part of content’s value never shows up as clicks at all. Growing awareness, trust, brand mentions in other people’s articles, and appearances in AI chatbot answers — all of this affects sales but doesn’t appear as a direct line in a report. That’s why content marketing effectiveness is evaluated through a combination of metrics at different levels, not a single number.
Attribution is the rule by which a conversion is credited to a particular channel. Last-click credits the final touch, first-click credits the first one, and distributed models account for the entire path. For content, it’s more important to look at assisted conversions than last-click alone.
Mini-FAQ for this section
Does this mean content can’t be measured? No. It can be measured, but comprehensively: combine reach and engagement metrics (fast-moving) with conversion and financial metrics (slow-moving), and evaluate results over a horizon of quarters, not weeks.
How to choose metrics for your goal and funnel stage
Before opening your analytics, answer the question: what is this specific piece of content for? The goal determines which content metrics even make sense.
- Awareness and top-of-funnel reach. Look at views, unique visitors, social media reach, and branded traffic. Expecting leads from an overview article like “what is X” makes no sense — its job is to attract attention and be remembered.
- Nurturing and mid-funnel engagement. Here, scroll depth, time on page, share of returning visitors, and newsletter sign-ups matter. The material should hold attention and lead the reader further.
- Bottom-of-funnel conversion. Case studies, comparisons, calculations — these are expected to generate leads and inquiries. You evaluate conversion to a target action, cost per lead, and number of deals.
- External publications and PR. For guest articles and media coverage, what matters is the number of publications, PR Points, Media Index, citation index, and traffic from publications.
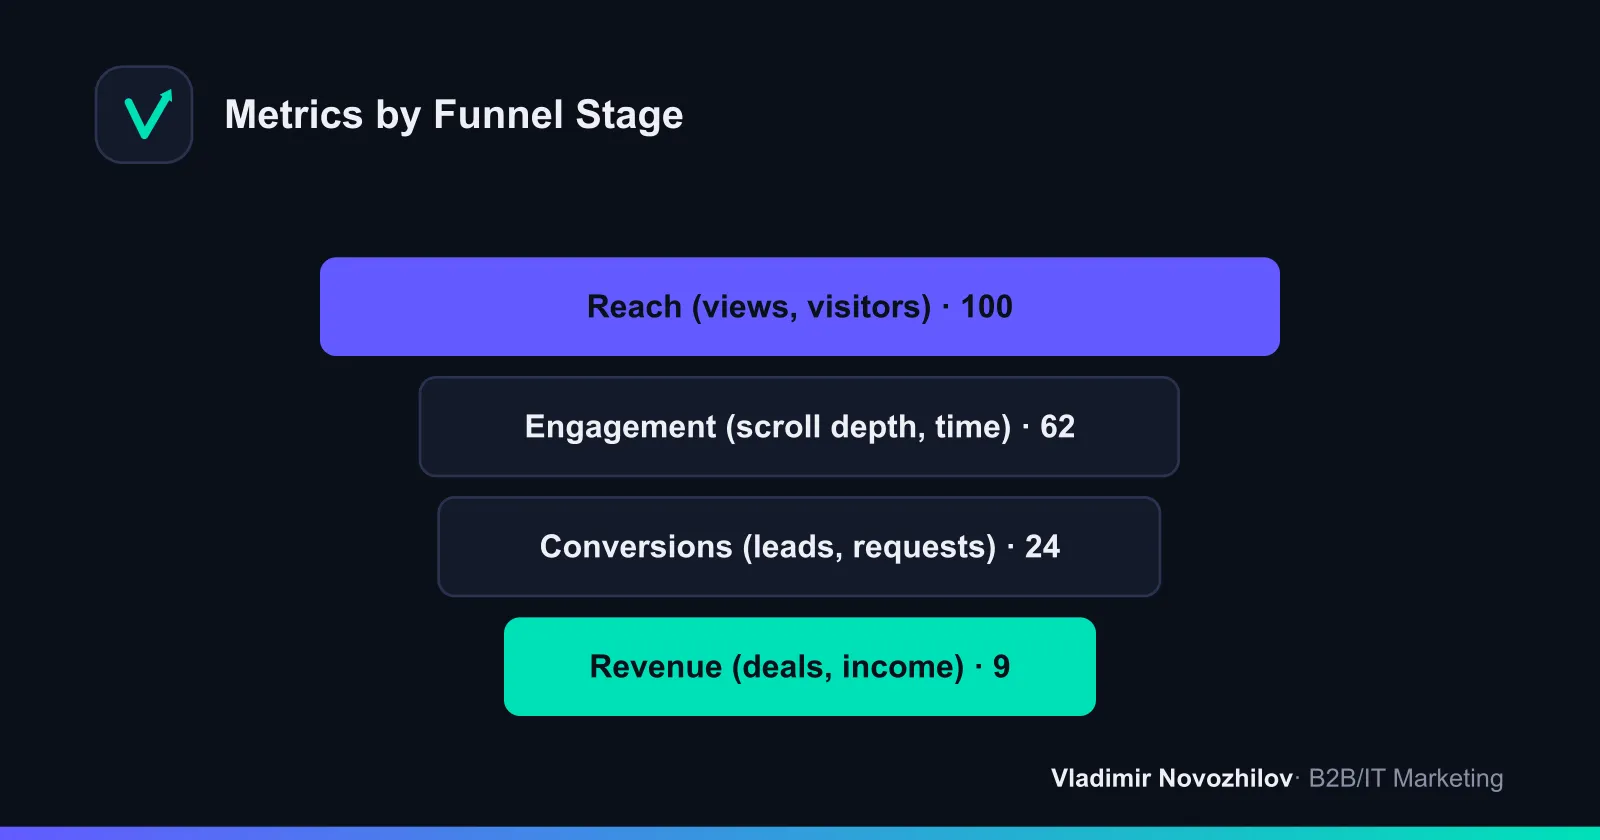
The logic is simple: each funnel stage has its own set of content marketing KPIs. Measuring content marketing correctly means matching the metric to the material’s purpose rather than applying one yardstick to everything.
Mini-FAQ for this section
Where do I start if I haven’t measured anything before? Take three metrics: traffic to the article, conversion to a target action, and the number of leads from content. That’s enough for the first month — expand the set from there.
Reach and visibility metrics: views, visitors, impressions
Reach metrics show how many people came into contact with your content. This is the top-level assessment — it’s not about money, but about audience scale.
- Page views — how many times the material was opened. One person can generate several views.
- Unique visitors — how many distinct people visited. A more honest reach metric than views.
- Social media and platform reach — how many people saw a post or announcement in their feed.
- Regional reach — which cities and countries the audience comes from; important if you operate in a specific geography.
- Share of returning users — how many readers come back. An indirect indicator that the content is valued.
Reach is the number of unique users who saw the material. Don’t confuse it with impressions: one user can generate several impressions but counts once toward reach.
Sample calculation. An article got 8,400 views and 6,100 unique visitors in a month. That means, on average, one person opened the material 1.38 times (8,400 / 6,100). The returning-visitor share is 14%. For an expert B2B long read, this is a normal level — people save such articles and come back.
Where to look: Yandex Metrica and GA4 for your website, and built-in platform/social media statistics for external placements. Reach metrics are easy to inflate with clickbait headlines, so never evaluate them in isolation from engagement.
Mini-FAQ for this section
Lots of traffic but no leads — is that a failure? Not necessarily. The material might be top-of-funnel and working for awareness. Check whether it moves the reader further down the funnel, and don’t expect conversions from overview articles.
Engagement metrics: bounce rate, scroll depth, time on site
Engagement metrics answer whether people actually read your content or close it after the second paragraph. This is the most underrated group of content metrics, even though it’s the one that tells you what to improve.
- Bounce rate — the share of visits where the person left without taking any action. A high bounce rate on a long article often means the headline promised one thing and the text delivered another.
- Page depth — how many pages a person viewed per visit. Shows whether content draws visitors deeper into the site.
- Scroll depth — how far down the page people read. In Yandex Metrica, you can see this via the scroll map: if 70% leave on the first screen, the problem is in the introduction.
- Time on site / time on page — how many minutes people spend reading. For a 2,500-word long read, a healthy average is 3–5 minutes.
- Reactions: comments, shares, ratings — a direct signal that the material resonated.
Scroll depth is a metric showing how far down the page a user reaches. It helps identify where readers lose interest and lets you move key blocks higher up.
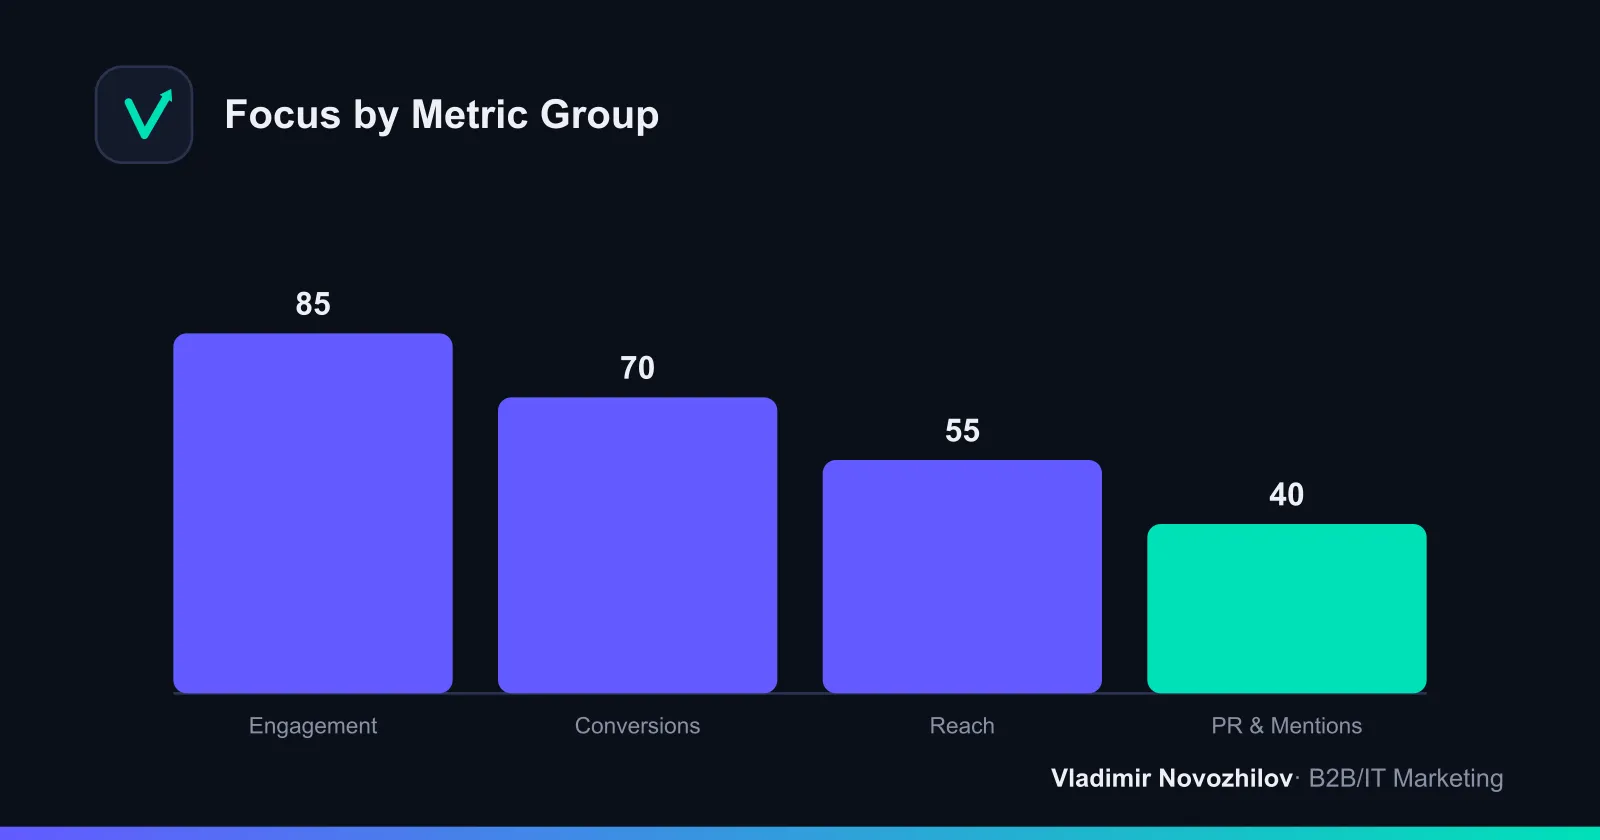
Sample calculation. An article had 6,100 visitors, of whom 2,200 scrolled to the end. Scroll depth to the footer is 36%. Average time is 2 minutes 40 seconds against an expected 4 minutes. Conclusion: people are arriving but not reading through. The fix — shorten the introduction, add subheadings and callouts, break up walls of text. After the edits, scroll depth rose to 51%, and conversion to inquiry nearly doubled, because more readers were reaching the CTA block.
Mini-FAQ for this section
What bounce rate should be considered normal? For blog articles, 60–75% is common, especially when a reader arrives from search, reads, and leaves satisfied. It’s concerning when bounce rate approaches 90% combined with short time on page — that means the content isn’t answering the query.
Visibility in AI search: how to check mentions in chatbot answers
A new and still poorly established group of metrics is visibility in AI search. AI models and features like AI Overviews increasingly answer users directly without sending them to a website. If your content is cited in these answers, you gain influence even without a click; if not, you lose part of your audience.
How to check mentions without a special budget:
- Compile a list of 15–30 real questions from your audience — ones your content answers.
- Ask them to AI models and in AI-powered search results. Record whether you appear in the answer, whether the brand is mentioned, whether a link is given, and whether the phrasing is accurate.
- Keep a monitoring table with columns for “query,” “mentioned (yes/no),” “phrasing,” and “date.” Recheck monthly.
- Watch traffic from AI services in Metrica and GA4 by traffic source — an indirect but growing signal.
AI Overviews are generative answers displayed directly in search results. Their growth means part of informational queries get resolved without a site visit, so it’s important to be a cited source in such answers.
To appear more often in AI answers, the same logic that works for featured snippets applies: clear definitions, short self-contained answers at the start of sections, lists, tables with formulas, and explicit “question — answer” blocks. These are the fragments models cite most readily.
Mini-FAQ for this section
Should I worry about traffic dropping because of AI answers? You should rebuild your measurement approach. If you used to measure only clicks, add a visibility-in-AI-answers metric: a brand mentioned in an AI answer still builds awareness, even when there’s no click-through.
Branded traffic and awareness growth
Branded traffic consists of visits and searches where people look for you by name: “company N reviews,” “N pricing,” “N blog.” Growth in branded traffic is one of the most honest indicators that content marketing is working for awareness.
The logic: someone read an article or saw you in the media, remembered you, and later searched for you directly. The more such queries, the more firmly you’ve established yourself in the audience’s mind.
How to measure:
- Yandex Wordstat — monthly trend in branded query frequency.
- Yandex Metrica and GA4 — share of branded traffic among search visits.
- Webmaster panels — impressions and clicks on brand-name queries.
Example. Before launching a blog and external publications, branded queries stayed around 900 per month. Six months into regular content, they reached 2,400 per month. A 2.7x increase with an unchanged ad budget is directly attributable to content and PR.
Mini-FAQ for this section
How do I separate branded traffic from overall traffic? In search query reports, filter phrases containing the company name, product name, and names of public employees. Everything else is non-branded traffic, which is also worth tracking separately.
Conversion metrics: leads, inquiries, target actions
Conversion metrics show whether content drives business actions. This is the shift from “interesting” to “left their contact info.”
- Conversion to target action — the share of readers who took the desired action (subscription, inquiry, download, sign-up). Formula: target actions / visitors × 100%.
- Leads from content — the number of inquiries that came from articles and publications.
- Cost per lead (CPL) — content costs / number of leads.
- Micro-conversions — intermediate actions: clicking a CTA, subscribing to a newsletter, adding to favorites. Especially important in B2B, where the deal is far off.
A target action is any user action that brings them closer to a deal: an inquiry, a call, a subscription, downloading a material. It’s set up as a goal in analytics.
Sample calculation. A case-study article drew 3,100 visitors in a month, 47 downloaded a template (micro-conversion), and 12 submitted an inquiry. Conversion to inquiry is 0.39% (12 / 3,100), and to micro-conversion, 1.52%. For the bottom of the funnel in services, 0.3–1% conversion to inquiry is a workable range.
To tie an inquiry specifically to an article, you need UTM tags on all links, goals configured in Metrica and GA4, and CRM deals tagged by source. Without this, conversions will get lumped into “direct traffic” and organic search without any detail.
Mini-FAQ for this section
What if content generates almost no conversions? Check whether the page has a clear next step. Often a great article ends with nothing — no form, CTA, or link to a related material. Add a call to action and a micro-conversion before writing the article off as ineffective.
Financial metrics: ROI, CAC, LTV, revenue from content
Financial metrics answer the leadership’s main question: does content pay off? This is the language in which marketing talks to the business.
- Content marketing ROI = (revenue from content − costs) / costs × 100%. Shows the return on every dollar invested.
- CAC (customer acquisition cost) = content costs / number of acquired customers. What it costs to acquire one customer from the channel.
- LTV — how much revenue a customer generates over the entire relationship. Comparing LTV and CAC shows whether the economics are healthy.
- Revenue from content — revenue from deals where content was a touchpoint.
CAC is the cost of acquiring one customer. In content marketing, it’s calculated as the cost of creating and promoting materials divided by the number of customers from that channel.
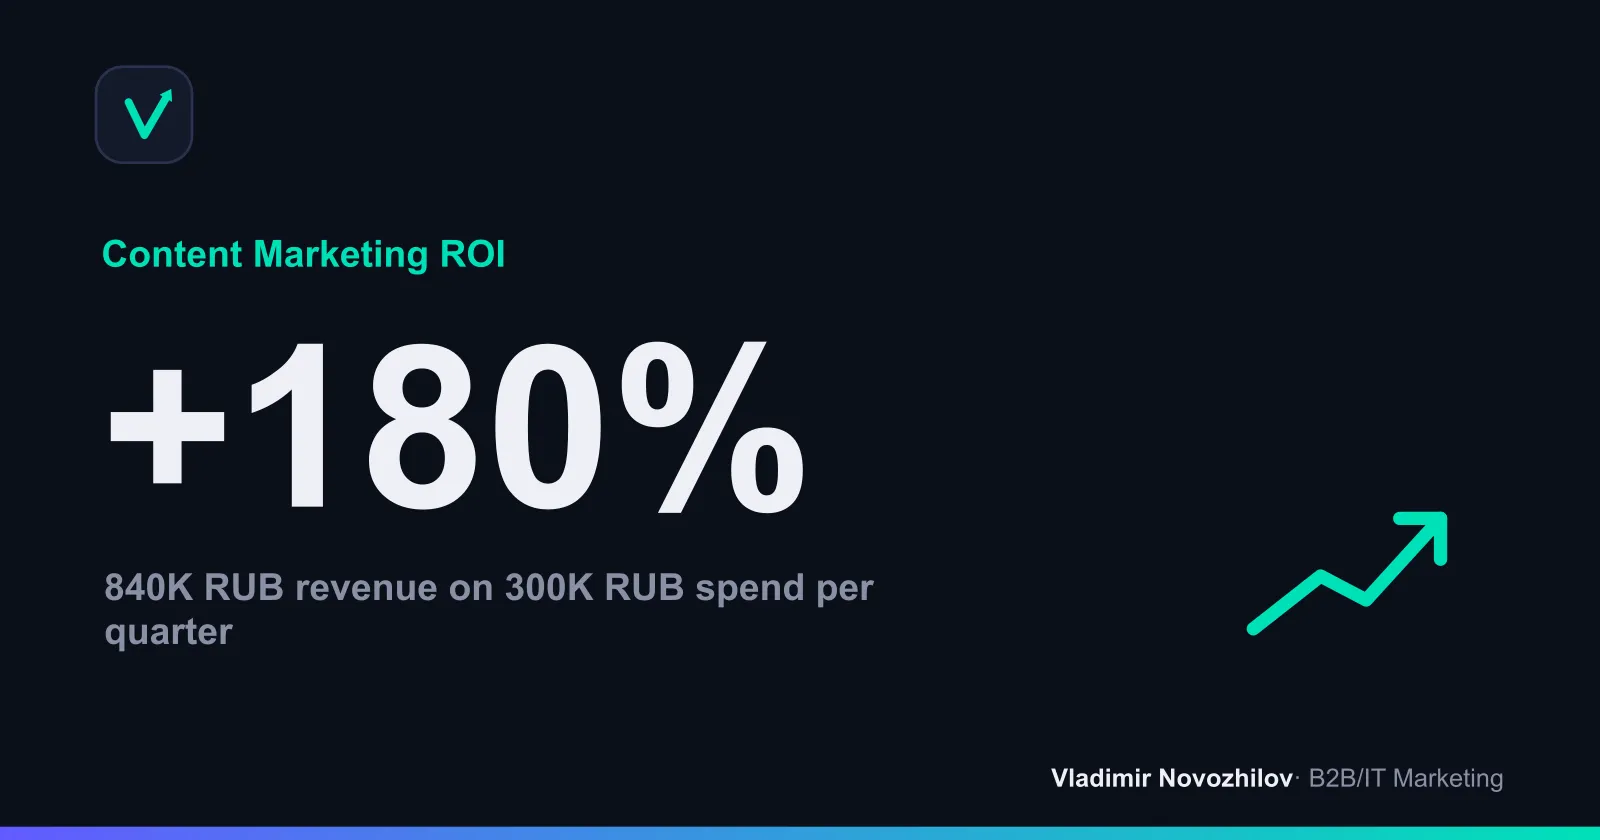
Step-by-step ROI calculation (as a substitute for a calculator).
- Calculate quarterly costs: writers, editing, design, promotion — 300,000 RUB.
- Pull deals tagged “content/blog” from the CRM: 6 deals.
- Average deal size — 140,000 RUB. Revenue from content: 6 × 140,000 = 840,000 RUB.
- ROI = (840,000 − 300,000) / 300,000 × 100% = 180%.
- CAC = 300,000 / 6 = 50,000 RUB per customer.
If you don’t have full-funnel analytics, estimate revenue in a simplified way: UTM-tagged leads × CRM deal conversion rate × average deal size. This is approximate, but enough to understand the order of magnitude of returns. In B2B with a long sales cycle, calculate ROI over a horizon of 2–4 quarters — otherwise costs are already incurred while deals haven’t closed yet, giving a distorted, overly pessimistic picture.
Mini-FAQ for this section
ROI came out negative in the second month — should I shut the channel down? No. Two months is just the ramp-up period for content. Watch traffic and lead trends: if they’re growing, the money will come later. Negative ROI at the start is normal for a cumulative channel.
PR metrics: number of publications, PR Points, Media Index, citation index
If you publish on external platforms and in the media, standard metrics are supplemented by PR metrics. They assess brand visibility in the media landscape.
- Number of publications and mentions — a basic activity indicator. On its own it says little about quality, but matters as a trend.
- PR Points — a point-based system for scoring publications: each placement gets points for the platform’s reach, tone, presence of a link, and spokesperson quotes. Allows comparing different publications on a single scale.
- Media Index — a measure of brand visibility in the media, accounting for the outlet’s reach, the company’s role in the piece, and the nature of the mention.
- Citation index — how often other sites cite you and link to your materials.
PR Points is a scoring method for media activity: publications receive points for platform influence, tone, and quality of mention, giving a unified scale for comparison.
Example. Over a quarter, 14 publications came out: 4 in major industry media (5 points each), 6 in niche blogs (3 points each), and 4 mentions without a link (1 point each). Total PR Points = 4×5 + 6×3 + 4×1 = 42 points. The following quarter — 58 points with the same number of publications: meaning the quality of the placements improved, not just the volume.
Media monitoring services and PR platforms (such as Pressfeed for receiving journalist requests) help track mentions. You don’t need to start with complex systems — manual searches by brand name are enough at first.
Mini-FAQ for this section
Are PR metrics needed if we only publish on our own blog? No. PR Points, Media Index, and citation index are relevant for external placements. For your own blog, reach, engagement, conversions, and ROI are enough.
Comparison table of metrics: what to measure at each stage
Below is a summary table of content marketing metrics with formulas, approximate benchmarks, and data sources. A table like this usually doesn’t exist among competitors, and it answers the “what and how to calculate” question at a glance.
| Metric | Funnel Stage | Formula | Benchmark | Where to Look |
|---|---|---|---|---|
| Unique visitors | Reach | Unique visit counter | Month-over-month growth | Metrica, GA4 |
| Social media reach | Reach | Unique users who saw the post | Depends on the platform | Platform statistics |
| Bounce rate | Engagement | Bounces / visits × 100% | 60–75% for a blog | Metrica, GA4 |
| Page depth | Engagement | Pages / visit | 1.5 and above | Metrica, GA4 |
| Scroll depth | Engagement | Readers who reached the end / visitors × 100% | 40–60% to the footer | Metrica scroll map |
| Time on page | Engagement | Total time / visits | 3–5 min for a long read | Metrica, GA4 |
| Conversion to action | Conversions | Actions / visitors × 100% | 0.3–2% to inquiry | Metrica, GA4, CRM |
| Cost per lead (CPL) | Conversions | Costs / number of leads | Lower than in paid channels | CRM + costs |
| Branded traffic | Awareness | Share of branded queries | Month-over-month growth | Wordstat, webmaster tools |
| ROI | Money | (Revenue − costs) / costs × 100% | >100% over the horizon | CRM, full-funnel analytics |
| CAC | Money | Costs / number of customers | 3x+ lower than LTV | CRM + costs |
| PR Points | PR | Sum of publication scores | Growth in placement quality | Media monitoring |
| Media Index | PR | Media visibility index | Trending upward | Monitoring services |
Tools for collecting and analyzing metrics
A separate comparison table of tools helps clarify what each one covers and where to start.
| Tool | What It Measures | Cost | Who Needs It |
|---|---|---|---|
| Yandex Metrica | Reach, engagement, scroll depth, Webvisor, goals | Free | Everyone, a base for the Russian-speaking market |
| Google Analytics 4 | Reach, events, conversions, user paths | Free | Everyone, especially with international traffic |
| UTM tags | Traffic and referral source | Free | Everyone, for attribution |
| CRM | Leads, deals, revenue, source | Paid tiers available | B2B and services with a sales process |
| Full-funnel analytics | Linking spend, leads, and revenue | Paid | Mature projects with multiple channels |
| Yandex Wordstat | Branded query trends | Free | For evaluating awareness |
| Mention monitoring services | Brand mentions in media and online | Paid | With active external PR |
| Pressfeed | Journalist requests, publications | Freemium | For working with the media |
The minimal free working setup is: Metrica + GA4 + UTM tags + Wordstat. This is enough to measure reach, engagement, conversions, and branded traffic. CRM and full-funnel analytics come into play once you have a steady lead flow and need to calculate money. Media monitoring services matter once external publications scale up.
How to build a regular content marketing report
A report isn’t for appearances — it’s for making decisions: what to strengthen, what to rewrite, what to shut down. Below is a checklist template you can move into a spreadsheet and fill in monthly.
Content marketing report checklist:
- Period and goal. Which month the report covers and what the content’s goal was.
- What was published. A list of published materials and external publications.
- Reach. Unique visitors, views, social media reach, trend vs. previous month.
- Engagement. Average scroll depth, time on page, bounce rate, top 3 and bottom 3 pieces.
- Branded traffic. Trend in branded queries and their share.
- AI search visibility. How many queries from the monitoring list mention the brand.
- Conversions. Target actions, leads, conversion to inquiry, CPL.
- Money. Deals from content, revenue, ROI, CAC (if CRM data allows).
- PR metrics. Publications, PR Points, mentions (for external placements).
- Conclusions and decisions. What worked, what to rewrite, plan for next month.
Rule of a good report: every number is accompanied by a comparison (to a previous period or a goal) and a conclusion. A number without context and without a decision is just clutter in a spreadsheet.
Common mistakes when evaluating content effectiveness
- Measuring everything at once. Thirty metrics in a report create an illusion of control but make it harder to see what matters. Choose 6–8 indicators tied to your goal.
- Judging content by traffic alone. Traffic without engagement and conversions is a vanity metric. Lots of visits with zero inquiries doesn’t equal success.
- Expecting ROI after a month. Content marketing is cumulative; early financial evaluation almost always produces a false negative.
- Ignoring attribution. Without UTM tags and CRM deal tagging, content’s contribution dissolves into “direct traffic.”
- Comparing incomparables. An overview article shouldn’t be judged by conversion, nor a case study by reach. Each piece has its own job.
- Forgetting scroll depth and time on page. These metrics show exactly where you’re losing readers — without them, you’re editing blind.
- Not accounting for a long sales cycle. In B2B, an inquiry often arrives months after the reading. Look at assisted conversions, not just last-click.
In brief: content marketing metrics
Content marketing metrics only work in combination and only when tied to a specific goal. Start with the basics: reach — how many people saw it; engagement — how they read it; conversions — how many reached out; money — whether the investment paid off. For external publications, add PR Points, Media Index, and citation index, and by 2025, visibility in AI search. Set up a free toolkit (Metrica, GA4, UTM, Wordstat), configure goals and CRM tagging, and keep a monthly report using the checklist — and content marketing effectiveness will stop being a black box.
FAQ on content marketing metrics
Which content indicators should I track first? Traffic and unique visitors (reach), scroll depth and time on page (engagement), conversion to target action and number of leads (conversions). These five metrics are enough to understand whether content is working and where to develop it further.
How do I measure content marketing if sales happen offline? Add UTM tags, set up goals for intermediate actions (downloads, call requests), and record the source in your CRM based on the question “how did you hear about us.” Also watch branded traffic — its growth indirectly confirms content’s influence on offline sales.
How do content marketing KPIs differ from regular metrics? A metric is any measurable indicator. A KPI is a metric you’ve designated as key for a specific goal and use to evaluate success. Content marketing KPIs are always tied to a business objective, not collected “for the sake of completeness.”
How do I know content is influencing sales in B2B with a long sales cycle? Look at assisted conversions and first touch in user paths, not just the last click. Often it’s an article that opens the funnel, while the deal closes months later through a different channel — this is visible in multi-channel funnel reports.
FAQ
- What is the most important content marketing metric?
- There's no single 'most important' metric — it all depends on the content's goal. For awareness, look at reach and branded traffic; for nurturing, scroll depth and time on page; for sales, leads and conversion to inquiry; for evaluating investment, ROI and CAC. The mistake is chasing one number (like traffic alone): content works through a combination of metrics across different funnel stages.
- How do I calculate content marketing ROI without full-funnel analytics?
- Use a simplified formula: ROI = (revenue from content − content costs) / costs × 100%. Estimate revenue from UTM-tagged leads and form submissions multiplied by average deal size and the CRM's deal conversion rate. If you don't have full-funnel analytics, ask new clients 'how did you hear about us' and log it in the deal record — this gives you approximate but workable attribution.
- How do I track that a customer came specifically from an article and not another channel?
- Add UTM tags to all links in articles and external publications, set up goals in Yandex Metrica and GA4, and tag CRM deals by source. For long sales cycles, use assisted conversions — an article often plays a role in the first touch, while the inquiry comes later through a different channel. So look at the full user path, not just last-click.
- How long does it take to see results from content marketing?
- Initial reach and engagement metrics are visible right after publication, organic search traffic usually grows over 3–6 months, and a steady lead flow with noticeable ROI in B2B with a long sales cycle typically appears after 6–12 months. Content marketing is a cumulative channel — judging it by first-month numbers is misleading.
- How do I check whether an AI chatbot mentions my brand in its answers?
- Ask AI models (and search AI Overviews) the same questions your audience types in, and record whether you appear in the answer and how you're described. Keep a query tracking table and recheck visibility monthly. Additionally, monitor traffic from AI services in Metrica and GA4 by source — it's an indirect but growing content signal.
- What free tools work for evaluating content without an analytics budget?
- The basic toolkit is free: Yandex Metrica (with scroll maps and Webvisor for scroll depth), Google Analytics 4, Yandex Wordstat for branded queries, and built-in platform and social media statistics. This is enough to measure reach, engagement, and conversions. Paid mention-monitoring services become necessary later, once content and external publications scale up.